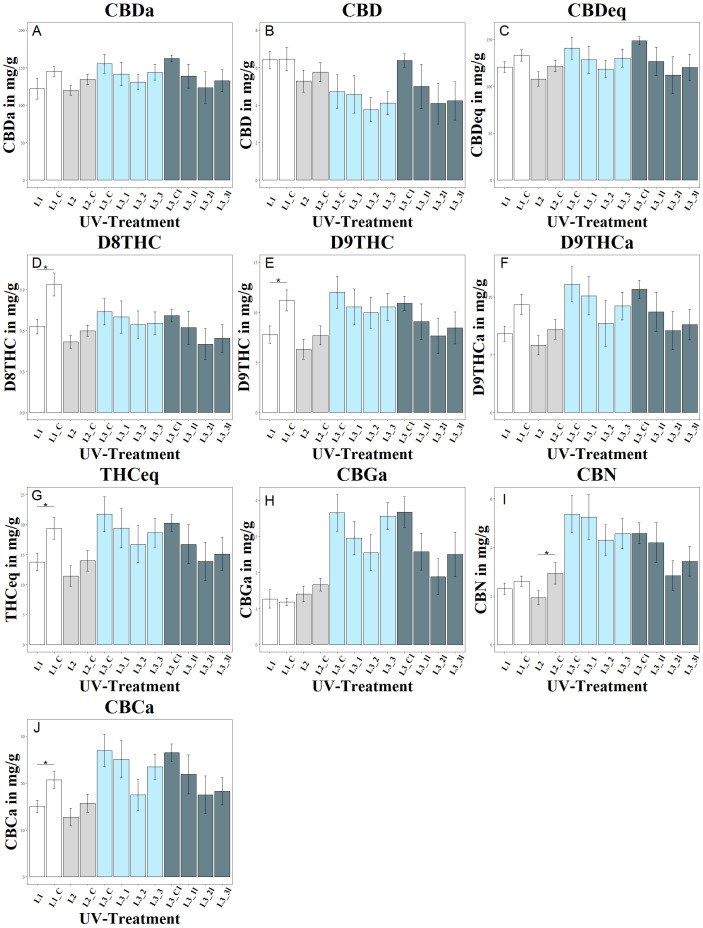
Figure 3.
Changes in cannabinoid composition as a function of UV exposure. Each letter (A–J) represents a different cannabinoid: (A) shows CBDA, (B) CBD, (C) CBDeq (CBD + CBDA), (D) D8THC, (E) D9THC, (F) D9THCa, (G) THCeq, (H) CBGA, (I) CBN, and (J) CBCA. Different UV intensities and ratios were tested: L1 with a UVA:UVB ratio of 67:33 (4.2 W/m2), L1_C: Control without UV, L2 with a high UVA:UVB ratio of 94:6 (4.99 W/m2), L2_C: Control without UV, L3 in increasing UVA:UVB ratio (99:1) at varying intensities (L3_1: 1.81 W/m2, L3_2: 4.12 W/m2, L3_3: 8.36 W/m2), L3_C: Control without UV, L3l in increasing UVA:UVB ratio (99:1) at varying intensities but harvested lateral flowers (L3_1l: 1.81 W/m2, L3_2l: 4.12 W/m2, L3_3l: 8.36 W/m2), L3_Cl: Control without UV. The bar graphs indicate cannabinoid concentrations under these conditions. Significance level: * (P ≤ 0.05).

