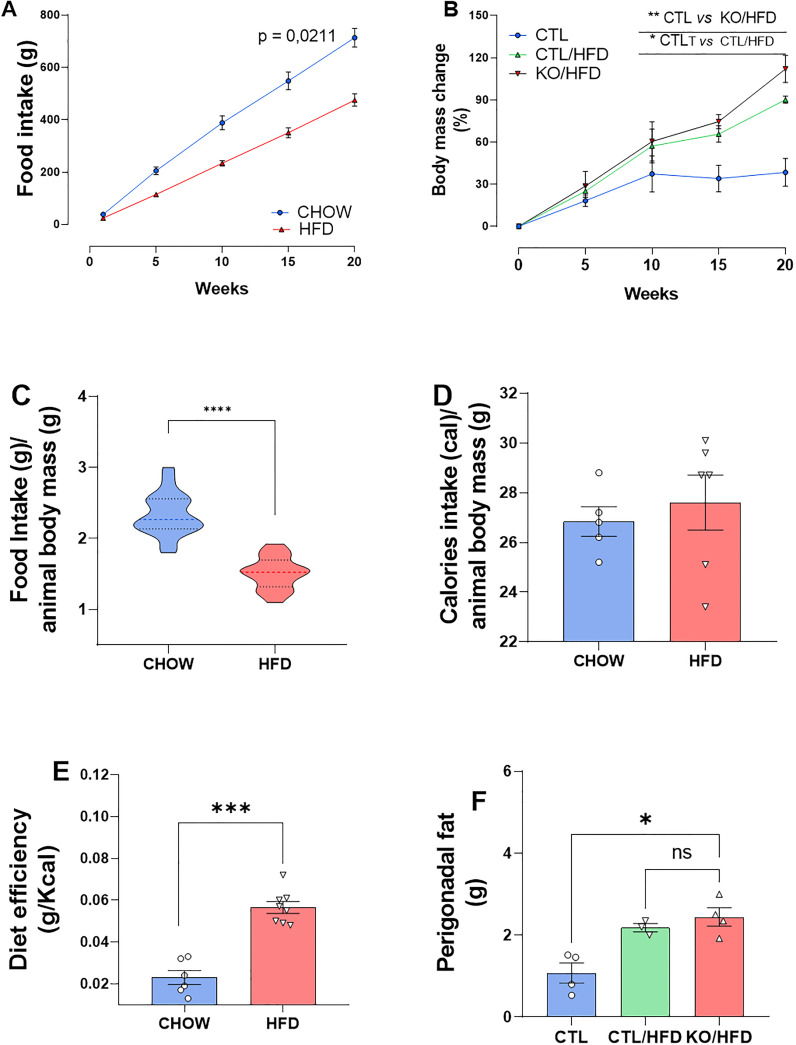
Figure 2.
Cumulative diet intake, caloric intake, caloric efficiency and food intake relative to the animals’ body mass, body mass gain and adipose tissue in response to exposure to a high-fat diet in knockout and CTL animals. Standard diet intake: n = 4 and HFD: n = 4 accumulated throughout the experiment (A). Standard diet intake: n = 4 and HFD: n = 4 normalized with animal mass (B). Daily calories consumed per animal standard diet: n = 6 HFD: n=8 (C). Standard diet efficiency: 6 HFD: 8 obtained through the ratio between the animal’s Δ mass (g) and caloric intake (Kcal) (D). Percentage of CTL body mass change: n = 3; CTL/HFD: n=3; KO/HFD: n=4 (E). Accumulation of perigonadal adipose tissue in response to exposure to high-fat diet or standard diet: CTL: n=3; CTL/HFD n=3; KO/HFD = 4 (F). Data shown as mean ± SEM. p values presented as *p<0.05, **p<0.005, ***p<0.001, ****p<0.0001, using Mann Whitney test for food efficiency of the diet and accumulated food intake, Student’s t-test for intake accumulated food and normalized by the mass of the animal. Using Kruskal Wallis Test with Dunn comparisons for perigonadal fat.

