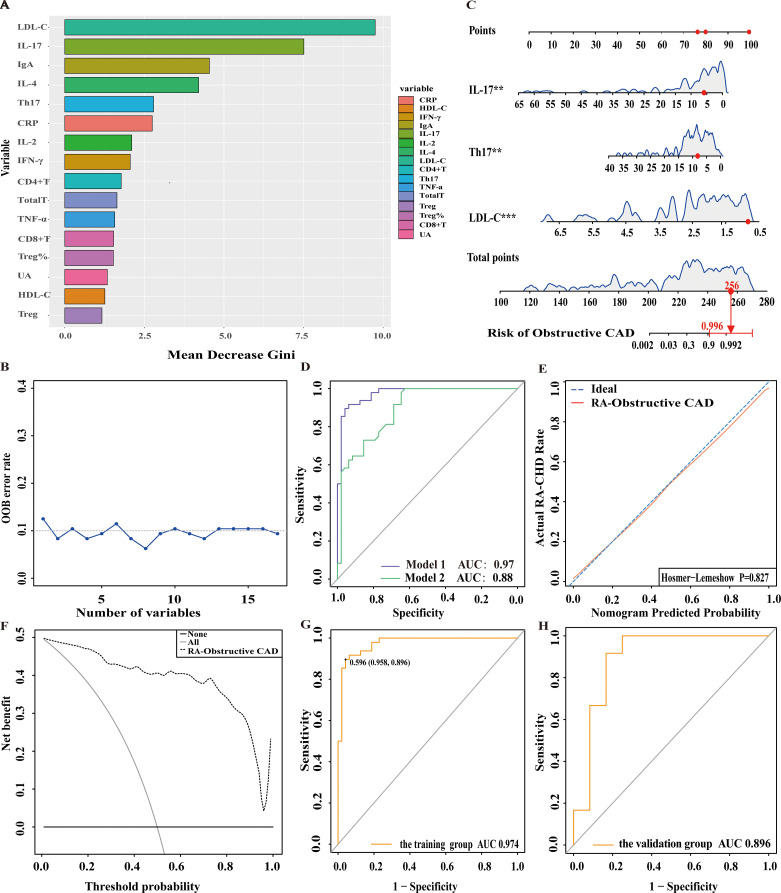
Figure 4.
Nomogram for predicting and assessing the risk of obstructive CAD in RA patients. (A) Ranking of risk factors for obstructive CAD development in RA patients by importance. (B) The relationship between the number of predictive indicators for obstructive CAD and the out-of-bag (OOB) error rate. (C) Nomogram for predicting the risk of obstructive CAD in RA patients. (D) Receiver operating characteristic (ROC) curves for predicting obstructive CAD risk in RA patients. Model 1: Nomogram incorporating LDL-C, Th17, and IL-17; Model 2: Nomogram incorporating LDL-C as the sole predictor. (E) Calibration curve for obstructive CAD risk prediction in RA patients. (F) DCA for predicting obstructive CAD risk in RA patients. (G) ROC curve of the nomogram for predicting obstructive CAD risk in the training cohort. (H) ROC curve of the nomogram for validating obstructive CAD risk in the external validation cohort.

