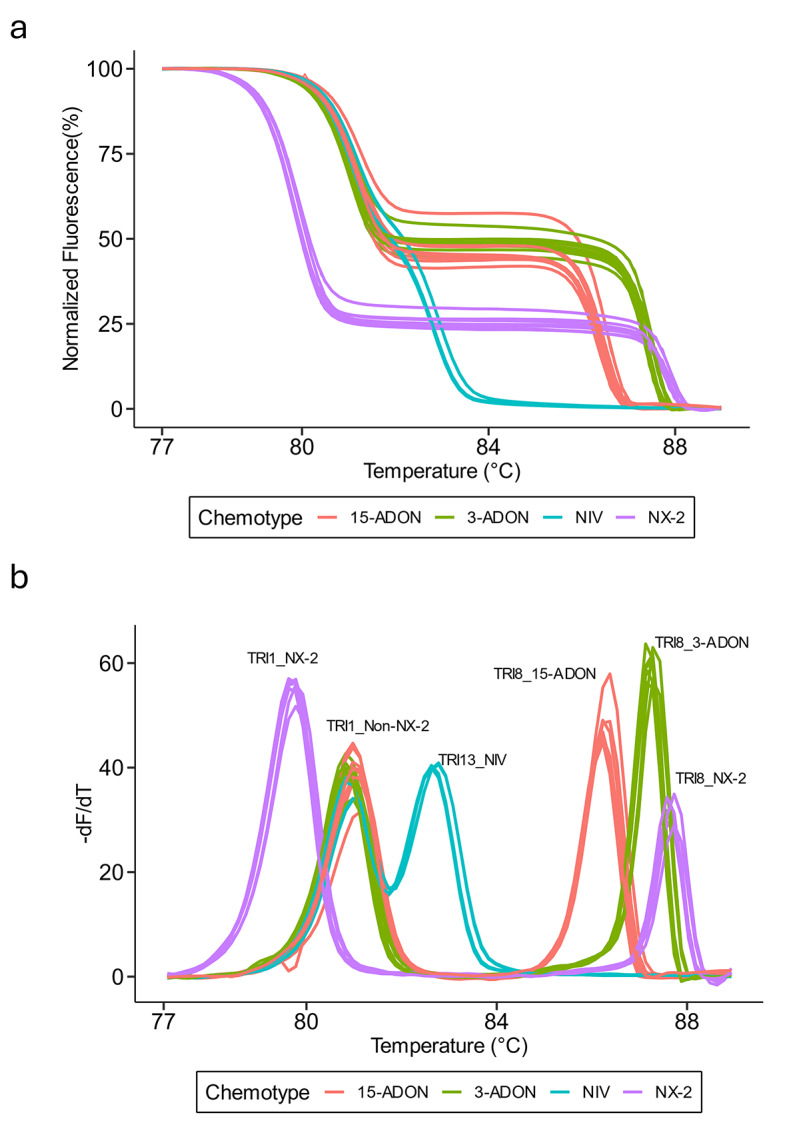
Fig. 3.

Multiplex HRM differentiates Fusarium graminearum chemotypes. (a) Normalized fluorescence plot derived from HRM analysis of F. graminearum isolates with each color representing a different reference isolate for each chemotype (PH-1, 15-ADON; 00-500, 3-ADON; 02–15, NIV; 06-156, NX-2). (b) Derivative melt plots of F. graminearum isolates representing each chemotype with the same coloration as (a). Each melting peak is labeled with the identity of the corresponding amplicon. Eight technical replicates were included per chemotype during the multiplex HRM assay run.
