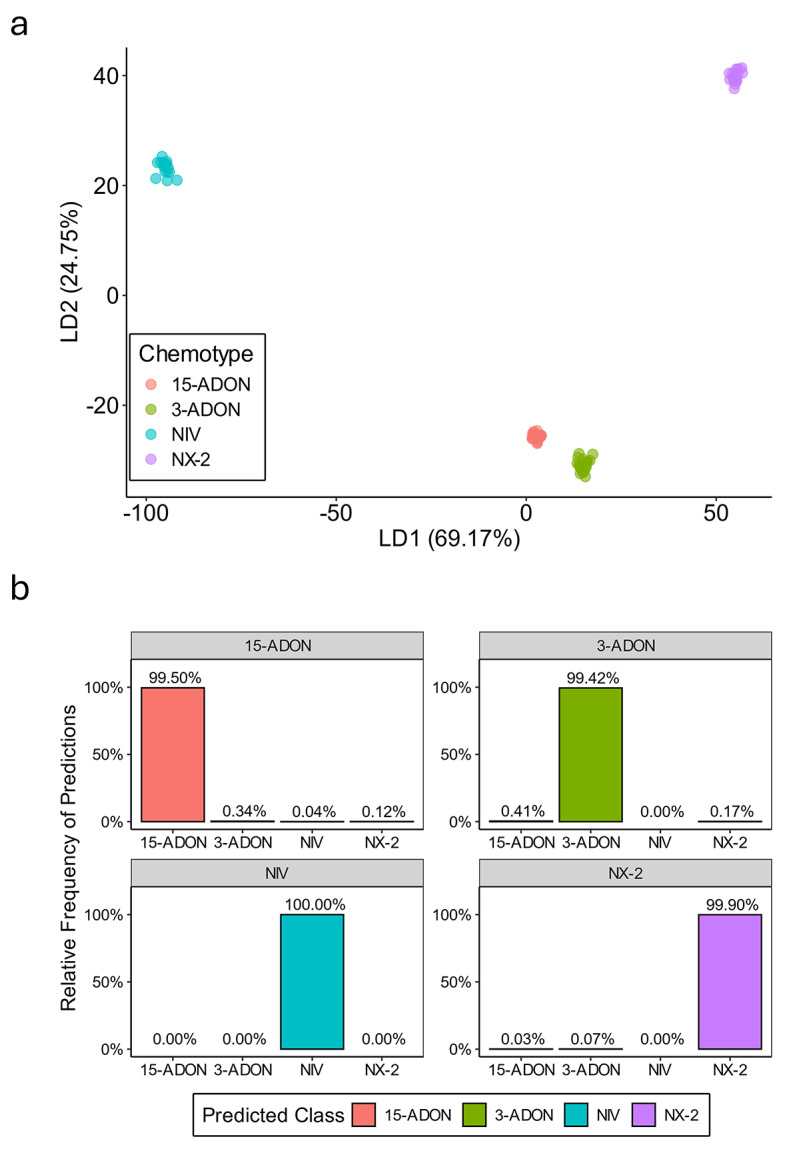
Fig. 4.

Validation of the multiplex HRM assay. (a) Linear discriminant analysis (LDA) plot of derivative melt data generated from the 80 isolates tested in this study. Each chemotype group is represented by a different color. The proportion of variance explained by the first (LD1) and second (LD2) linear discriminant functions is shown on the x- and y-axis, respectively. (b) Cross-validation results using 1,000 iterations of randomly selecting ~ 20% of the isolates to train an LDA classifier and using it to predict the chemotype class of the remaining isolates. Chemotype predictions are shown on the x-axis and the relative frequency of the predictions is portrayed on the y-axis. The gray bar at the top indicates the true chemotype assignment based on independent assays (Supplementary Table S1).
