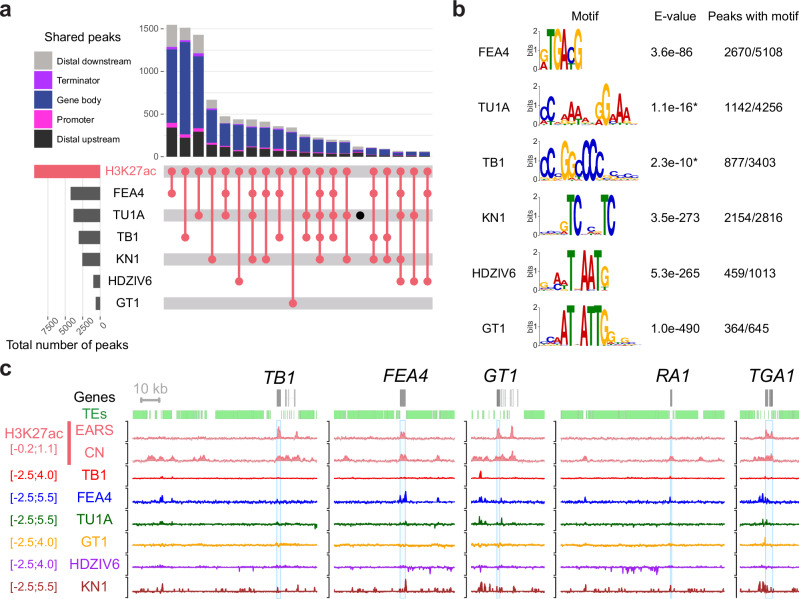
Fig. 2. Enhancers at domestication genes are bound by transcription factor networks.
a Upset plot showing the overlap between H3K27ac peaks identified in B73 and binding sites of six transcription factors (TFBS) analyzed in this study. The total number of peaks called for each sample is shown on the histogram on the left-hand side. The number of shared peaks between the different samples are shown above the intersection matrix, each peak being colored by the genomic feature it intersects with. The majority of the TFBS are indeed within H3K27ac peaks, mostly overlapping gene bodies or at distal regions (>2 kb from a gene) and highlights the interplay between these TFs. b Best binding motif identified in each TF peaks with meme or streme (*)97. The motifs correspond to the respective family of each TF. c Browser screenshots at major domestication loci (TB1, GT1, RA1 and TGA1) as well as FEA4, which regulates a domestication trait, showing complex regulation of these developmental TFs with often co-regulation and auto-regulation.

