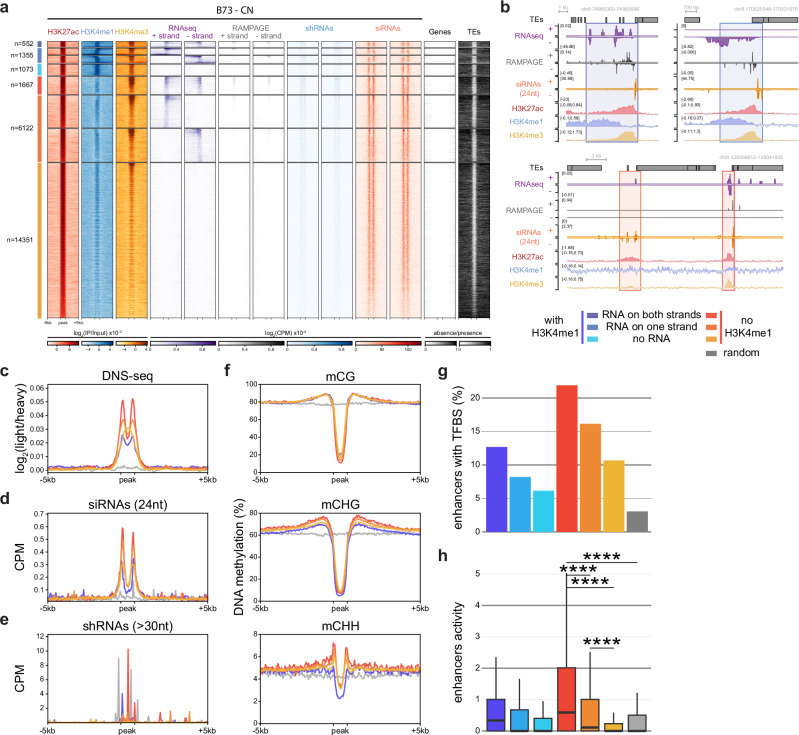
Fig. 5. Enhancers with bi-directional enhancer RNAs are associated with stronger activity and higher RdDM at their boundaries.
a Heatmap of ChIP-seq and transcriptomic signals in B73 coleoptilar node (CN) at distal H3K27ac peaks and ±5kb surrounding regions. Six classes of regulatory regions were identified based on the presence (blue) or the absence (red) of H3K4me1 peaks within 1 kb, and on the presence of RNA-seq reads mapping to both strands, one strand, or none (from darker to lighter shades). The short RNA-seq datasets were split into longer fragments (>30nt) and canonical siRNAs (24 nt). Presence (black) and absence (white) of annotated genes and TEs surrounding the peaks are shown, demonstrating the absence of annotated features within regulatory regions. b Browser screenshots of representative examples of uni- and bi-directionally expressed H3K27ac peaks (boxed), with (upper) and without (lower) H3K4me1 peaks. H3K4me1 peaks indicate the presence of unannotated genes. c–f Metaplots at the three clusters without H3K4me1 peaks (red, as in a), the three clusters with H3K4me1 peaks merged together (blue), and random control regions (gray) of DNA accessibility (c) in differential nucleosome sensitivity (DNS-seq) from CN35, 24nt siRNAs (d) and short RNAs (>30nt) (e) generated in CN in this study, as well as DNA methylation in each sequence context (f) from seedlings59. These metaplots show that the bi-directional enhancers are more accessible regions with higher transcription levels of shRNAs, depleted of DNA methylation, but also more protected from neighboring TEs by targeting of RNA-directed DNA methylation by 24nt siRNAs. g Percentage of peaks containing at least one transcription factor binding site (TFBS) from the TFs analyzed in this study. h Measure of enhancer activity for each cluster by STARR-seq10. Bi-directionally expressed enhancers drive statistically higher transcription (STARR-seq value within the enhancer) than uni-directional, not expressed or control regions (two-sided t test, **** p < 10−5). Data shows distribution of median STARR-seq value at all B73 CN enhancers (numbers shown in a), with the boxplot showing the mean and ranging from first to third quartiles, whiskers mark 1.5×IQR, and outliers are not shown.

