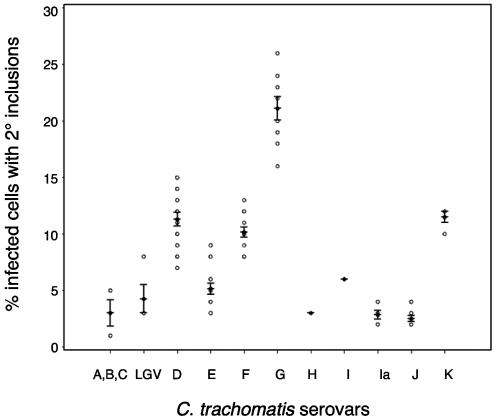
FIG. 2.
Quantitation of secondary inclusion formation by serovar. McCoy cells were infected with clinical isolates of each chlamydial serovar (MOI = ∼0.3) and fixed 28 hpi. The percentage of infected cells with secondary inclusions is plotted as a function of chlamydial serovar. The median for each serovar is represented by a black circle, while the individual strain data points are shown in open circles. The means and 95% confidence intervals are indicated for each serovar.

