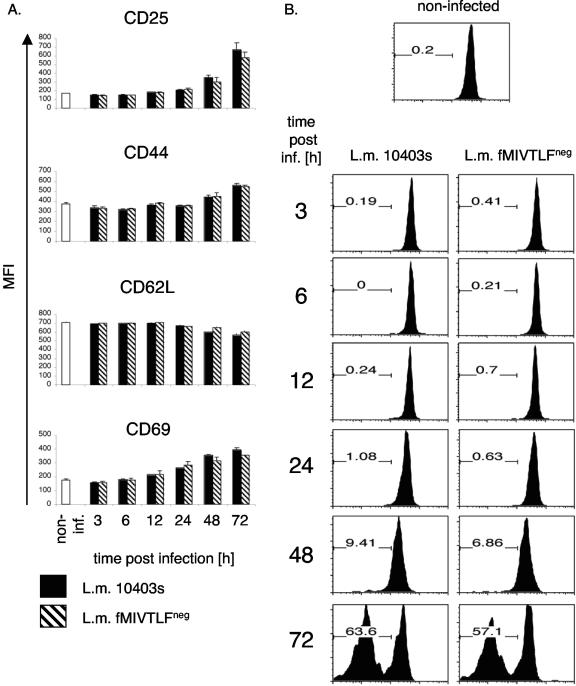
FIG. 2.
Kinetics of fMIVTLF-specific CD8+ T-cell activation early after primary infection. (A) CFSE-labeled splenocytes (1 × 10⁶) from C10.4 B6.PL TCR tg mice were adoptively transferred into C57BL/6 recipients. The mice were left untreated (noninfected [non-inf.]) (white bars) or were infected with 5,000 L. monocytogenes (L.m.) 10403s (black bars) or L. monocytogenes fMIVTLFneg (hatched bars). At the indicated time points, splenocytes were stained with anti-CD8, anti-Thy1.1, and one of the indicated antibodies (CD25, CD44, CD62L, and CD69). The surface expression levels for the various activation markers of the transferred C10.4 TCR tg T cells (CD8+ Thy1.1+) are plotted as the mean fluorescent intensity (MFI). (B) T-cell proliferation was measured at the indicated time point postinfection (post inf.) by analysis of CFSE dilution. Flow cytometric histograms are gated on donor CD8+ Thy1.1+ T cells and are representative of three mice per group. The number in each plot represents the percentage of C10.4 TCR tg T cells that underwent at least one round of division.

