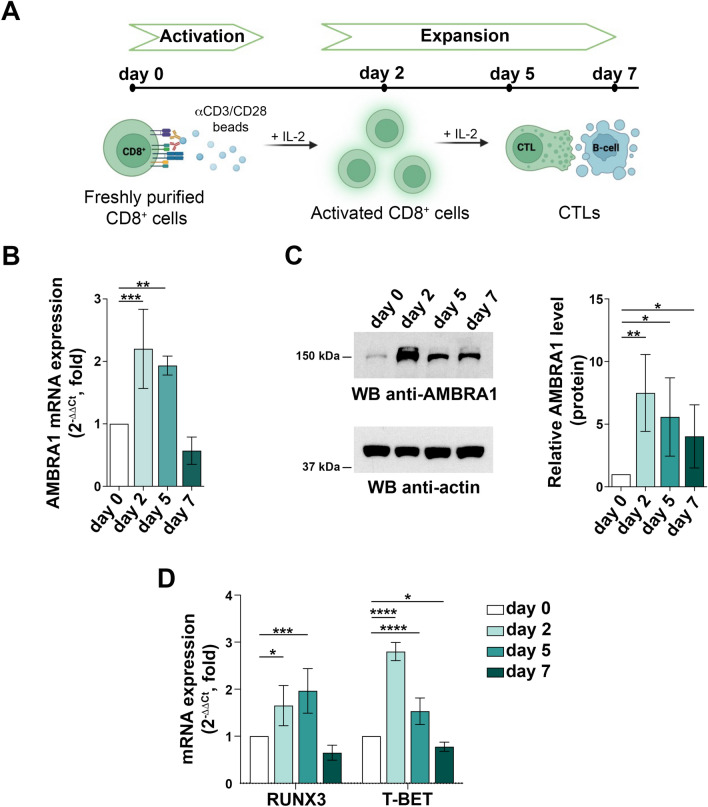
Fig. 1.
AMBRA1 expression is upregulated during CD8+ T cell differentiation to CTLs. (A) Workflow of in vitro CD8+ T cell differentiation starting from human CD8+ T cells purified from buffy coats of healthy donors. Freshly isolated CD8+ T cells (day 0) were activated with anti-CD3/CD28 coated beads in the presence of IL-2 and expanded for 5–7 days to generate CTLs. (B) RT-qPCR analysis of AMBRA1 mRNA and (C) immunoblot analysis of AMBRA1 protein levels in CD8+ T cells collected at days 0, 2, 5 and 7 after stimulation. 18S was used for normalization in RT-qPCR analysis. Actin was used as loading control. The migration of molecular mass markers is indicated. The histograms show the quantification of AMBRA1 expression during CTL differentiation (ndonor
 3, one sample t test, day 0 value = 1). (D) RT-qPCR analysis of human TBET and RUNX3 mRNA in CD8+ T cells at days 0, 2, 5 and 7 after stimulation. 18S was used for normalization (ndonor = 3, one-way ANOVA test, day 0 value = 1). Data are shown as mean fold ± SD, day 0 value = 1. * P ≤ 0.05; ** P ≤ 0.01; *** P ≤ 0.001; **** P ≤ 0.0001.

