Fig. 4.
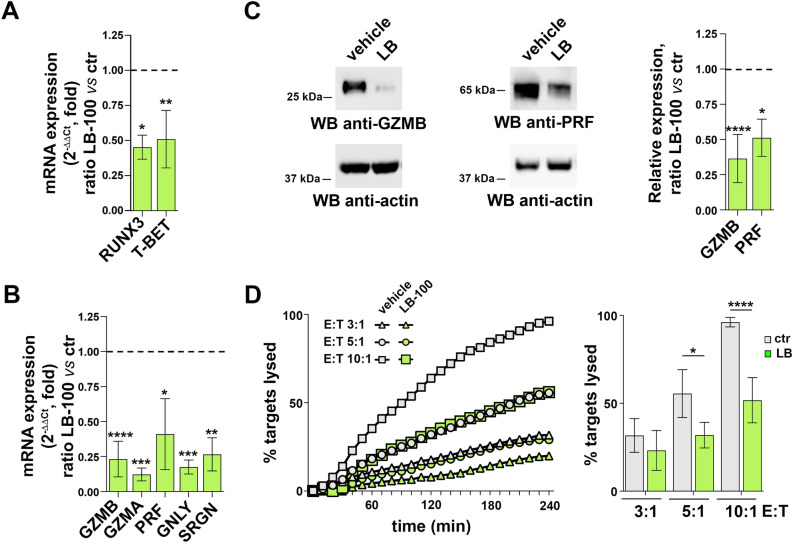
The AMBRA1 interactor PP2A is required for CTL differentiation and function. (A) RT-qPCR analysis of RUNX3 and T-BET mRNA in CTLs treated with LB-100 or vehicle (DMSO). 18S was used for normalization. Data are shown as mean fold ± SD (ndonor = 3, one sample t test, vehicle value in CTLs set as 1). (B) RT-qPCR analysis of GZMA, GZMB, PRF, GNLY and SRGN mRNA in CTLs treated with LB-100 inhibitor or vehicle. Data are shown as mean fold ± SD (treated vs untreated CTLs). 18S was used for normalization (n  3, one sample t test, vehicle value = 1). (C) Immunoblot analysis of the LG components GZMB and PRF in CTLs treated with LB-100 inhibitor or vehicle. Actin was used as loading control. The migration of molecular mass markers is indicated. The histogram shows the quantification of GZMB and PRF protein expression in LB-100-treated CTLs related to untreated CTLs. Data are shown as mean fold ± SD (ndonor = 3, one sample t test, vehicle value = 1). (D) Real-time calcein release-based killing assay. CTLs either untreated or treated with LB-100 were co-cultured with sAg-loaded Raji B cells at the target:effector ratios indicated. The graph shows the kinetics of target cell killing quantified by measuring calcein fluorescence every 10 min for 4 h. The histogram shows the quantification of the percentage of target cell death at the endpoint (4 h) of independent experiments carried out on CTLs from ndonor = 3, performed in duplicate. Data are shown as mean fold ± SD (n = 3, one-way ANOVA test). * P ≤ 0.05; ** P ≤ 0.01; *** P ≤ 0.001; **** P ≤ 0.0001.

