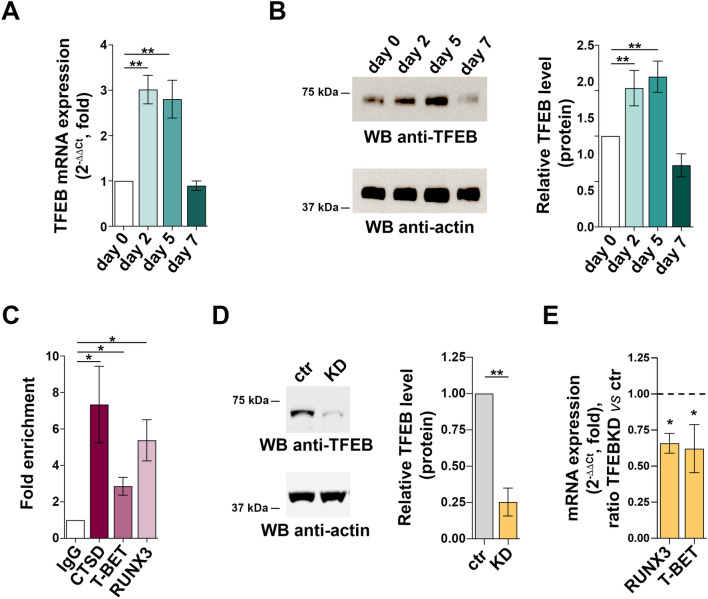
Fig. 5.
TFEB regulates expression of the CTL-specific pioneer transcription factors RUNX3 and T-BET. (A) RT-qPCR analysis of TFEB mRNA and (B) immunoblot analysis of TFEB protein in CD8+ T cells at days 0, 2, 5 and 7. 18S was used for normalization in RT-qPCR analysis. Actin was used as loading control. The migration of molecular mass markers is indicated. The histograms show the quantification of TFEB levels during CTL differentiation related to CD8+ T cells at day 0. Data are shown as mean fold ± SD (ndonor = 3, one-way ANOVA test, day 0 value = 1). (C) ChIP assays of nuclear extracts of CD8+ T cells at day 2 of differentiation using either anti-TFEB or control unspecific rabbit IgG antibodies. Selected regions of the RUNX3 and TBET promoters containing putative binding sites for TFEB were amplified by qRT-PCR. Data are show as fold enrichment (the percentage of input DNA of TFEB-Ab IP samples vs ctrl IgG-Ab samples (ndonor = 3, one sample t test). (D) Immunoblot analysis of human TFEB protein in control (scramble RNAi) and TFEB KD CTLs. Actin was used as loading control. Molecular weights are indicated at the left side of the representative immunoblot image. The histogram shows the quantification of TFEB expression in KD CTLs vs control CTLs. Data are shown as mean fold ± SD (ndonor = 3, one sample t test, ctr value = 1). (E) RT-qPCR analysis of human RUNX3 and T-BET mRNA in control and TFEB KD CTLs.18S was used for normalization. Data are shown as mean fold ± SD (ndonor = 3, one sample t test, ctr value = 1). * P ≤ 0.05; ** P ≤ 0.01; **** P ≤ 0.0001.

