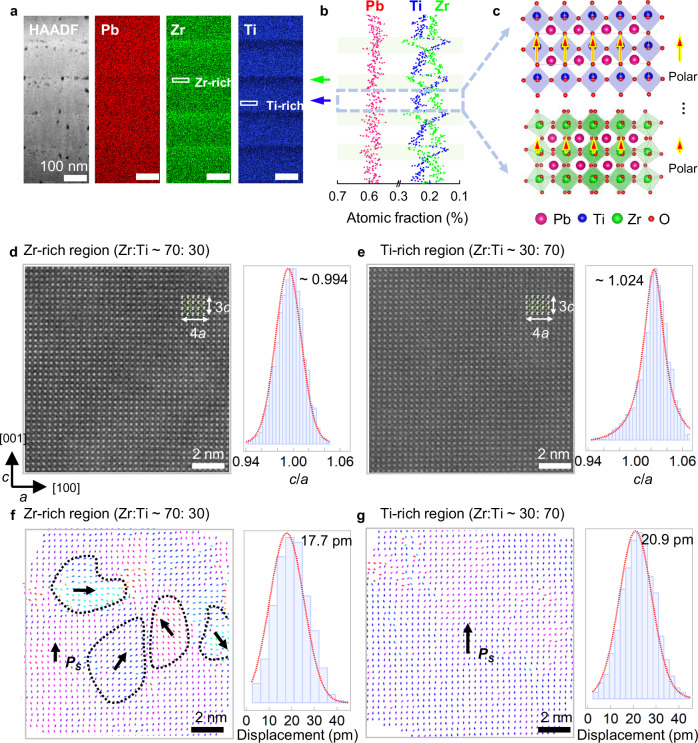
Fig. 3. Composition and atomic-scale analysis.
a Cross-sectional scanning transmission electron microscopy image indicates layer-by-layer growth of the prepared film with the maps of different cation elements, Pb, Zr, and Ti. Each PZT layer is approximately 100 nm. b Quantified atomic fractions of A- and B-site elements. The maximum composition variation, as indicated by Zr/Ti could be from 70:30 to 30:70. c Crystallographic structures at Zr- and Ti-rich regions in a layer as marked by the rectangle with varying polarization magnitude. d, e Atomic-resolution images at Zr-rich and Ti-rich regions. Images on the right side are histograms of the c/a ratio at respective regions. f, g The maps of atomic-scale polarization at Zr-rich and Ti-rich regions as calculated from the A- and B-site atomic positions in corresponding Atomic-resolution images. Images on the right side are histograms of the displacement magnitude at respective regions.

