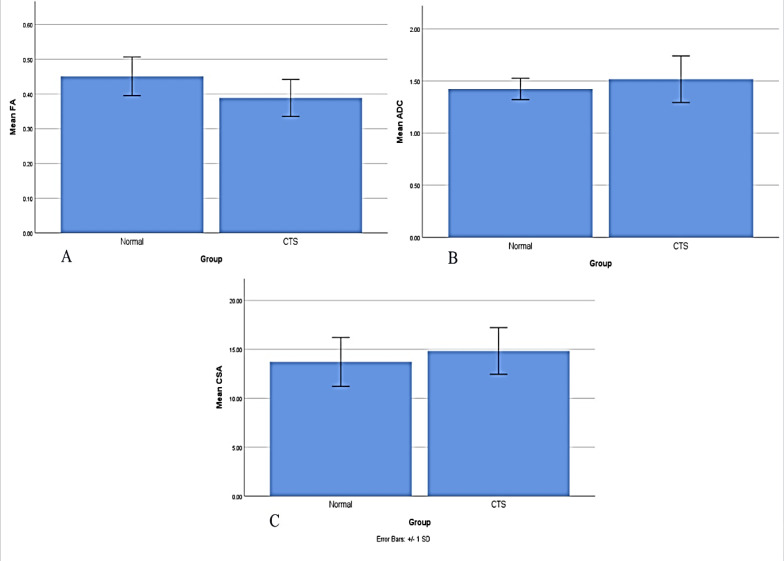
Figure 2.
Magnetic resonance neurography (MRN) parameters of patients with carpal tunnel syndrome (CTS) and controls
A) Comparing the mean fractional anisotropy (FA) between two groups with CTS and healthy controls; B) Comparing the mean apparent diffusion coefficient (ADC) between two groups with CTS and healthy controls; C) Comparing the mean cross-sectional area (CSA) between two groups with CTS and healthy controls

