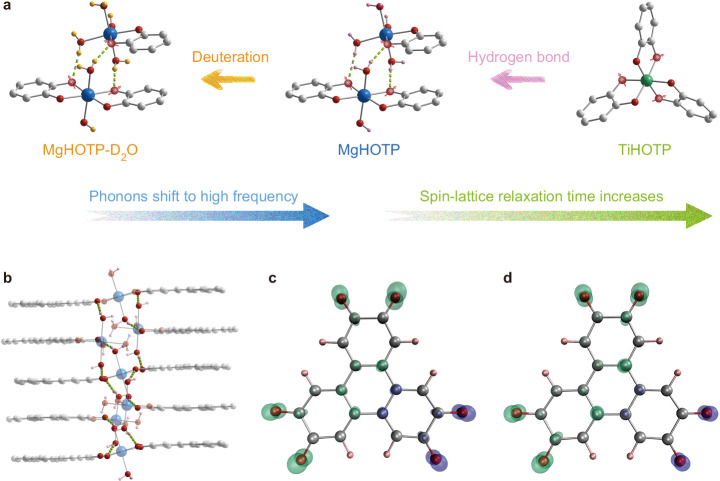
Fig. 1. Crystal structures and spin density distributions of MQFs.
a Phononic modulation of spin-lattice relaxation in MQFs via hydrogen-bonded networks and their deuteration. Green dash lines represent hydrogen bonds. Grey, pink, yellow, red, blue, and green spheres represent C, H, D, O, Mg, and Ti, respectively. Red spheres with arrows represent possible oxygen sites where electron spins mainly reside. H atoms of HOTP ligands, solvent molecules, and (CH3)2NH2+ cations are omitted for clarity. b A portion of MgHOTP structure viewed perpendicular to the crystallographic c axis, highlighting hydrogen-bonded networks. c, d Spin density distribution of HOTP under c, 1-electron and d 3-electron oxidation (isosurface = 0.01). Green and purple clouds represent positive and negative spin densities, respectively.

