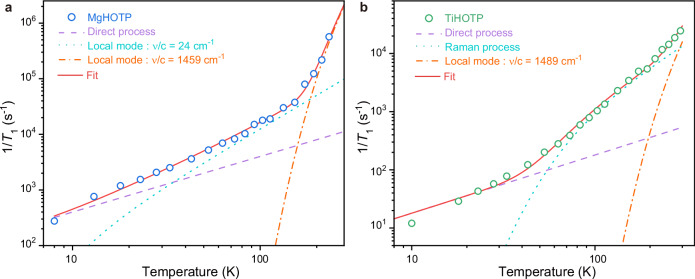
Fig. 4. Spin-lattice relaxation mechanisms of MgHOTP and TiHOTP.
Spin-lattice relaxation rates (1/T1) of a MgHOTP and b TiHOTP acquired at various temperatures and their fitting results based on Eq. 1. Circles represent experimental data. Red solid lines represent overall fits. Purple dash lines represent contributions from direct processes. Light blue dot lines represent contributions from the local-mode process driven by the 24 cm−1 optical phonon for MgHOTP or the Raman process for TiHOTP. Orange dash-dot lines represent contributions from local-mode processes driven by C−O stretches in semiquinone moieties.

