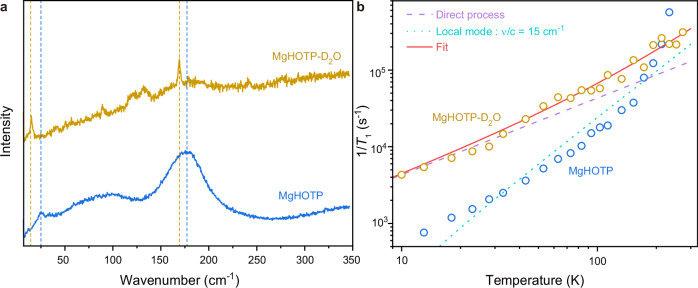
Fig. 5. Isotope effects of spin-lattice relaxation in MgHOTP.
a Raman spectra of MgHOTP and MgHOTP-D2O collected at 2 K and under 0.34 T with 633 nm excitation. Blue dash lines mark the maxima of peaks at 24 cm−1 and 177 cm−1 for MgHOTP. Yellow dash lines mark the maxima of peaks at 15 cm−1 and 169 cm−1 for MgHOTP-D2O. b. Spin-lattice relaxation rates of MgHOTP and MgHOTP-D2O. Circles represent experimental 1/T1 data acquired at various temperatures. Fitting results are only shown for MgHOTP-D2O. The red line presents the overall fit. The purple dash line and light blue dot line represent contributions from the direct process and the local-mode process driven by the 15 cm−1 optical phonon for MgHOTP-D2O, respectively.

