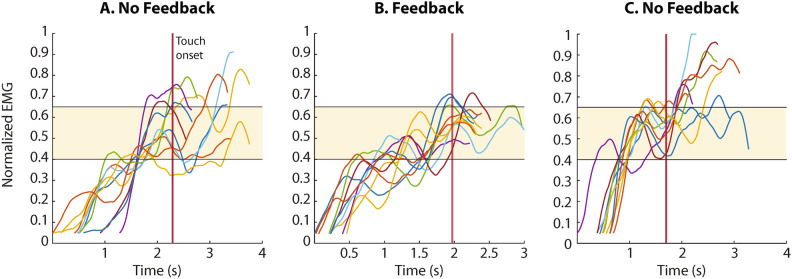
Fig. 2.
Example myoelectric signals produced by the participant in Session 2 when the task was to close the hand and generate level 3 of target force. Panels A and C are the trials from the first and last blocks performed without feedback while B shows the trials from the second block executed with feedback. The myoelectric signals display several overshoots when the subject did not receive feedback (plots A and C), while the signals were contained within the target range (EMG level 3, shaded area) when feedback was active (plot B). The myoelectric signals are shown from the moment they surpassed the dead zone, until the moment the maximum force was applied in each trial, and they are aligned to the touch onset (vertical red line). The EMG traces presented were generated with the right (amputation) side pectoralis major of the participant.

