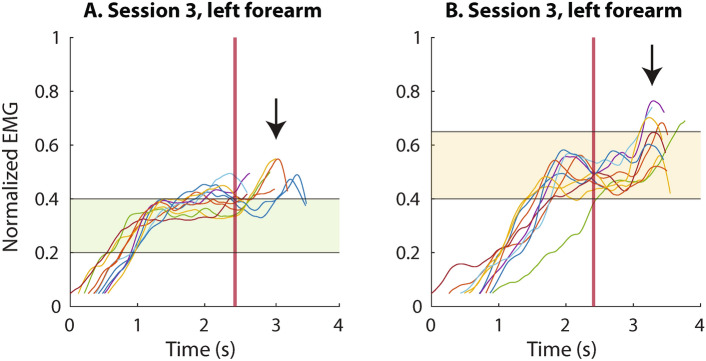
Fig. 4.
Example traces recorded in session 3, when reaching for target force levels 2 (plot A) and 3 (plot B), illustrating unusual behavior of the participant in this session. The subject correctly achieved the target EMG level but then inadvertently executed a contraction “impulse” (black arrow) while attempting to relax his muscles. The myoelectric signals are shown from the moment they surpassed the dead zone, until the moment the maximum force was applied in each trial, and they are aligned to the touch onset (vertical red line).

