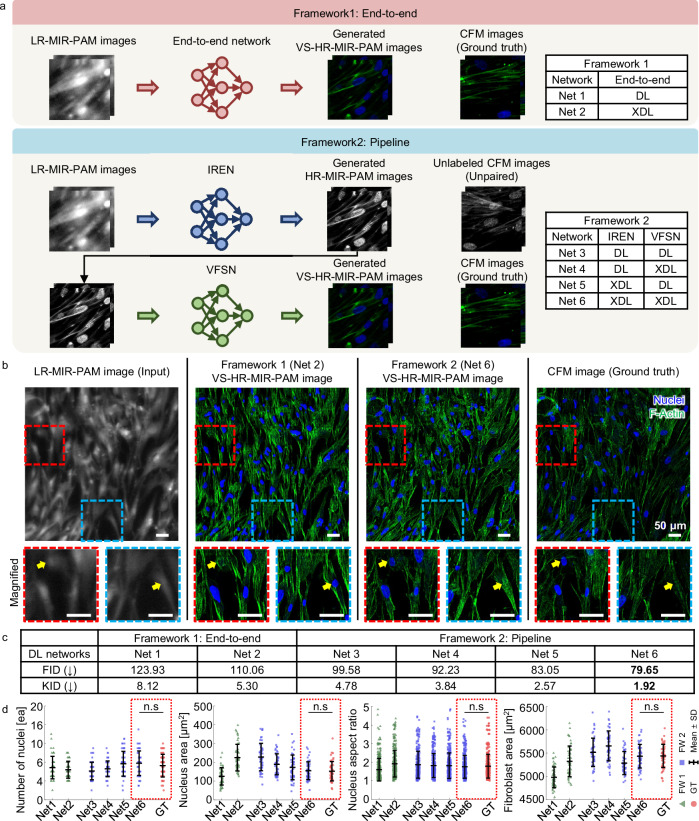
Fig. 5. Comparative performance of frameworks applied to the XDL-MIR-PAM.
a Schematic of two types of frameworks. b Visual and (c)table for quantitative comparison between the networks. Scale bars, 50 μm. In the VS-HR-MIR-PAM images of HCFs, the blue and green channels refer to the cell nuclei and F-actins, respectively. The best scores are highlighted in bold font. d Quantitative comparisons of the number of nuclei, nucleus area, nucleus aspect ratio, and fibroblast area among various frameworks (n = 49, mean ± SD). For the DL and XDL, the CycleGAN and explainable CycleGAN are adopted, respectively. Significance by one-way ANOVA with Dunnett’s multiple comparisons test: n.s, not significant (p > 0.05). p = 0.7059 (number of nuclei), p = 0.9999 (nucleus area), p = 0.9564 (nucleus aspect ratio), and p = 1.0000 (fibroblast area). Source data and p-values are provided as a Source Data file.

