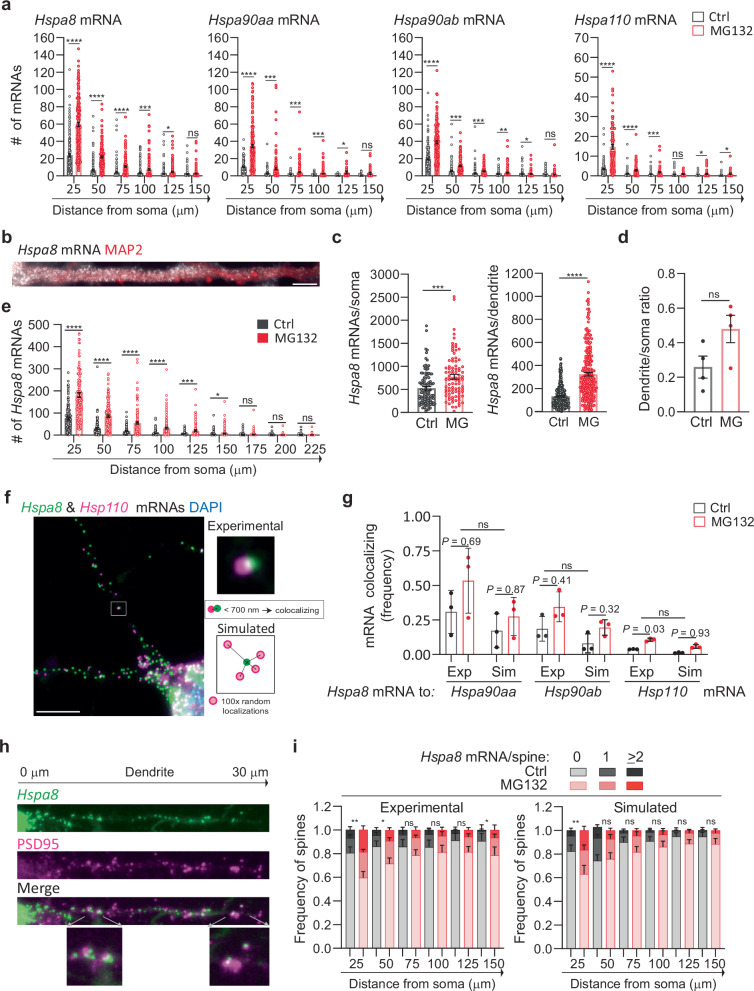
Fig. 3. Stress-induced changes in dendritic HSP mRNA localization in primary neurons.
a Quantification of the dendritic mRNAs located in 25-μm bins based on their distance from the soma. Data are the mean ± SEM of three independent experiments (Hspa8 control n = 185, Hspa8 MG132 n = 181, Hsp90aa control n = 116, Hsp90aa MG132 n = 184, Hsp90ab control n = 182, Hps90ab MG132 n = 146, Hsp110 control n = 143, Hsp110 MG132 n = 88 dendrites); dots indicate individual dendrites. ****P < 0.0001, ***P < 0.001, **P < 0.01 (P = 0.0019 (Hsp90ab), *P < 0.05 (P = 0.021 (Hspa8) 0.024 (Hsp90aa), 0.021 and 0.011 (Hsp110), ns no significant (P = 0.28 (Hspa8) 0.29 (Hsp90aa) 0.54 and 0.64 (Hsp90ab) 0.097 (Hsp110) (by multiple unpaired t-tests, two-sided). b smFISH detection of Hspa8 mRNAs in the dendrites of an MG132-stressed primary mouse motor neuron stained with MAP2. Scale bar = 5 μm. c Quantification of somatic and dendritic Hspa8 mRNAs in Ctrl and MG132-stressed motor neurons. Data are the mean ± SEM of four independent experiments (control n = 100 neurons, MG132 n = 87 neurons, control n = 280 dendrites, MG132 n = 237 dendrites). ****P < 0.0001, ***P < 0.001 (by unpaired t-test, two-tailed). d Ratio of Hspa8 mRNA per area of dendrite or soma (in pixels) in Ctrl and MG132-stressed motor neurons. Data are the mean ± SD of data analyzed in (c). ns no significant P = 0.079 (by unpared t-test, two-tailed). e Quantification of Hspa8 mRNAs per 25-μm bin. Data are the mean ± SEM of the experiment in (c). ****P < 0.0001, ***P < 0.001, *P < 0.05 (P = 0.014), ns no significant (P = 0.41 (175) 0.52 (200) and 0.30 (225) (by multiple unpaired t-tests, two-sided). f Two-color smFISH detection of Hspa8 and Hsp110 mRNAs in a primary hippocampal neuron stressed with 10 μM MG132 for 7 h. The square shows a magnified view of two colocalizing mRNAs and the scheme represents the calculation of colocalization (<700 nm away) in the experimental data and random simulations. Scale bar = 5 μm. g Frequency of colocalization between Hspa8 mRNA and Hsp90aa, Hsp90ab, or Hsp110 mRNAs per dendrite in Ctrl and MG132-stressed primary hippocampal neurons. Exp indicates experimental data. Sim indicates simulated data that is the average of 100 random simulations of the positions of each detected Hspa90aa, Hspa90ab, or Hsp110 mRNA in a specific dendrite. Data are the mean ± SD of three independent experiments from (a). P values to compare Ctrl to MG132 in Exp to Sim data by multiple two-tailed unpaired t-test are indicated and Exp to Sim data comparison is ns no-significant (P = 0.25) (by Wilcoxon matched-pairs signed rank, two-tailed). h Detection of Hspa8 mRNAs in relation to the dendritic spines, identified by anti-PSD95 IF. The distances shown are in relation to the soma. The lower images show magnifications of mRNAs localizing to the dendritic spines in the areas indicated by the arrows. i Frequency of dendrites with 0, 1, and 2 or more Hspa8 mRNAs localizing within 600 nm of the center of the PSD95 IF signal in Ctrl and MG132-stressed primary hippocampal neurons from panel (a). Dendritic spines were assigned to 25-μm bins based on their distance from the soma. Data are the mean ± SEM of six independent experiments. Simulated data are the average of 100 random simulations of the positions of each detected Hspa8 mRNA in the specific dendritic bin. **P < 0.01 (Exp P = 0.0041 (25), Sim P = 0.0033 (25); *P < 0.05 (Exp P = 0.013 (50) and 0.048 (150); ns, no significant (Exp P = 0.41 (75) 0.18 (100) 0.093 (125), Sim P = 0.18 (50) 0.23 (75) 0.45 (100) 0.13 (125 and 150) (by chi-squared test). Comparison between Exp and Sim was ns in Ctrl and MG132 (P = 0.84 and 0.90 (25), 0.05 and 0.79 (50), 0.66 and 0.29 (75), 0.81 and 0.63 (100), 0.56 and 0.30 (125) and 0.68 and 0.14 (150) (by chi-squared test). Source data are provided as a Source Data file.

