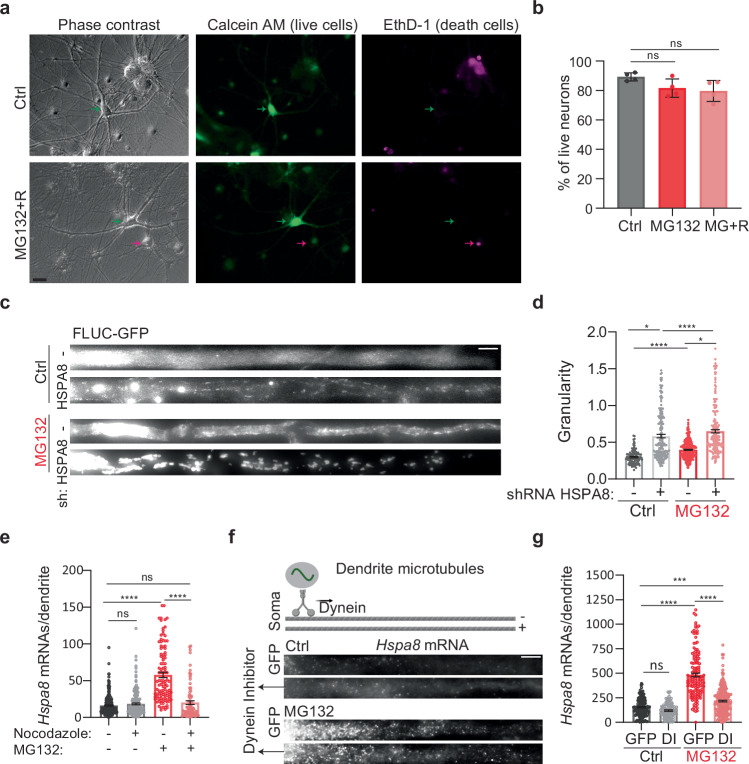
Fig. 4. Function and transport of dendritic HSP mRNAs.
a Representative neurons from Ctrl and MG132-stress spinal cord motor neurons double-stained to identify live (Calcein, green) and dead (EthD-1, magenta) neurons, position indicated with arrows. Scale bar = 10 μm. b Quantification of the live neurons in Ctrl, MG132-stress (10 μM for 7 h), and recovery ((MG + R) 10 μM MG132 for 7 h and 4 h after MG132 washout). Data are the mean ± SD of four independent experiments (n = 83 (Ctrl), 99 (MG132), and 121 (MG132 + R) neurons). ns; no significant (P = 0.125 by Wilcoxon-matched pairs test, two-sided). c Representative dendrites from Ctrl and MG132-stressed spinal cord motor neurons expressing the proteostasis reporter plasmid FLUC-GFP with and without HSPA8 knockdown. GFP aggregation is proportional to proteostasis loss. Scale bar = 10 μm. d Quantification of the GFP signal granularity (the coefficient of variation) in each dendrite in C. Data are the mean ± SEM of three independent experiments (no shRNA control n = 116 dendrites, HSPA8 shRNA control n = 190 dendrites, no shRNA MG132 n = 334 dendrites, HSPA8 shRNA MG132 n = 213 dendrites). ****P < 0.0001; *P < 0.05 (P = 0.013(Ctrl) and 0.014 (MG132) by ordinary 1-way ANOVA). e Quantification of dendritic Hspa8 mRNAs in Ctrl neurons and MG132-stressed neurons with and without nocodazole exposure. Data are the median ± SD of three independent experiments. Three independent experiments were performed (control n = 287, Nocodazole n = 226, MG132 n = 111, Nocodazole + MG132 n = 85 dendrites; dots indicate individual dendrite values). ****P < 0.0001; ns no significant (P = 0.59 (MG132−) and 0.94 (Nocodazole+) by ordinary 1-way ANOVA). f Schematic of microtubule orientation and dynein transport in dendrites. smFISH detection of Hspa8 mRNAs in the dendrites of Ctrl and MG132-stressed neurons. Scale bar = 5 μm. Created in BioRender. ALAGAR, L. (2024) l35j827. g Quantification of somatic and dendritic Hspa8 mRNAs in Ctrl and MG132-stressed motor neurons microinjected with a plasmid expressing GFP or a Dynein Inhibitor (DI). Data are the mean ± SEM of three independent experiments (GFP control n = 148, Dynein control n = 144, GFP MG132 n = 101, Dynein MG132 = 249 dendrites). ****P < 0.0001, ***P < 0.001; ns no significant (P = 0.40) (by ordinary 1-way ANOVA). Source data are provided as a Source Data file.

