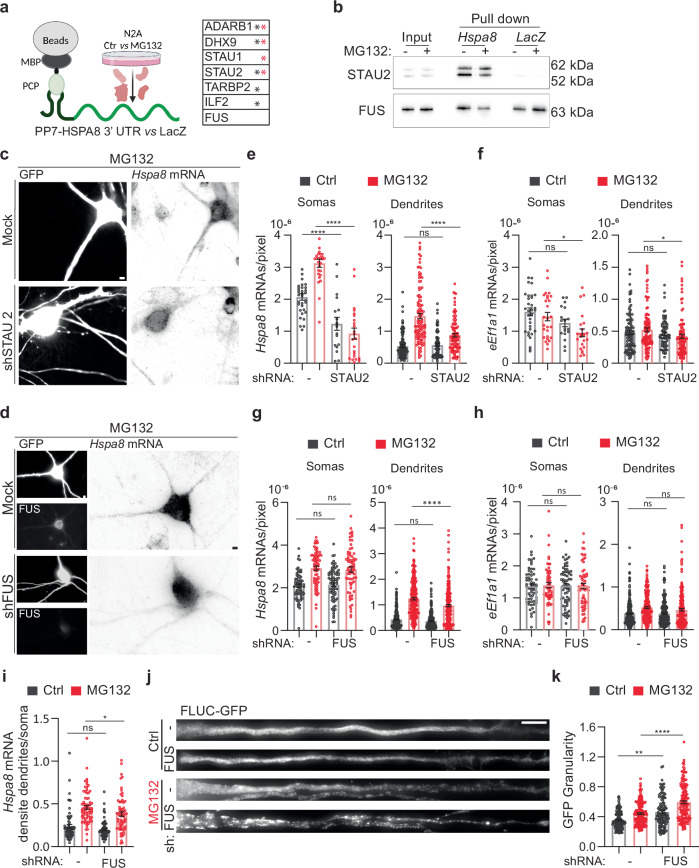
Fig. 6. FUS regulates dendritic Hspa8 mRNA localization and neuronal proteostasis in mouse motor neurons.
a Schematic of the pulldown strategy used to identify RBPs binding to the Hspa8 3′ UTR, and a table of the RBPs identified as specifically bound to the Hspa8 3′ UTR in extracts from Ctrl (black *) and MG132-stressed (red *) N2A cells by MS (Created in BioRender. ALAGAR, L. (2024) https://BioRender.com/f90a722). Proteomics data is provided in Source data. b Pulldown experiments to validate the binding of STAU2 and FUS to the Hspa8 3′ UTR were analyzed by western blot in two independent replicates. I input, PD pulldown. c, d Representative images of primary mouse motor neurons expressing GFP (Ctrl) or GFP and shRNAs against STAU2 (c) or FUS (d). Three days after microinjection, stress was induced with 10 μM MG132 for 7 h, and Hspa8 mRNA expression was detected by smFISH. Scale bars = 5 μm. e–h Quantification of the densities of Hspa8 (e, g) and eEf1a1 (f, h) mRNAs per pixel of soma or dendrite area in Ctrl and MG132-stressed motor neurons expressing GFP with and without the indicated shRNA expression plasmids. For STAU2, the data are the mean ± SEM of three independent experiments (neurons GFP control n = 33, GFP MG132 n = 27, STAU2 shRNA control n = 18, STAU2 shRNA MG132 n = 23; dendrites GFP control n = 105, GFP MG132 n = 111, STAU2 shRNA control n = 72, STAU2 shRNA MG132 n = 98; dots indicate individual soma and dendrite values). P values for Hspa8 mRNA (****P < 0.0001, ns no significant (P = 0.99)) and for eEf1a1 mRNA (Soma: **P < 0.01 (0.031), ns no significant (P = 0.26), Dendrites: *P < 0.05 (0.076), ns no significant (P = 0.98). For FUS, five independent experiments (neurons GFP control n = 69, GFP MG132 n = 72, FUS shRNA control n = 75, FUS shRNA MG132 n = 69; dendrites GFP control n = 246, GFP MG132 n = 232, FUS shRNA control n = 255, FUS shRNA MG132 n = 224). P values for Hspa8 mRNA (Soma: ns no significant (P = 0.88 in Ctrl and 0.1 in MG132), Dendrites: ***P < 0.001; ns no significant (P = 0.905)) and for eEf1a1 mRNA (Soma: ns no significant (P = 0.99 in Ctrl and MG132), Dendrites: ns no significant (P = 0.99 in Ctrl and 0.34 in MG132)) (by 1-way ANOVA). i Ratio of the dendrite to soma Hspa8 mRNA density calculated by averaging the number of mRNAs/pixel of all dendrites of a neuron and dividing it by the number of mRNA/pixel of soma. The data are the mean ± SEM of three independent experiments (GFP control n = 70, GFP MG132 n = 72, FUS shRNA control n = 75, FUS shRNA MG132 n = 69 neurons) from G. *P < 0.05 (P = 0.021); ns no significant (P = 0.13) (by 1 way ANOVA). j Representative dendrites from Ctrl and MG132-stressed motor neurons expressing the proteostasis reporter plasmid FLUC-GFP with and without FUS knockdown. GFP aggregation is proportional to proteostasis loss. Scale bar = 10 μm. k Quantification of the GFP signal granularity (the coefficient of variation) in each dendrite in I. The data are the mean ± SEM of four independent experiments (GFP control n = 97, GFP MG132 n = 138, FUS shRNA control n = 88, FUS shRNA MG132 n = 115 dendrites). ****P < 0.0001;**P < 0.01 (P = 0.0021) (by 1 way ANOVA). Source data are provided as a Source Data file.

