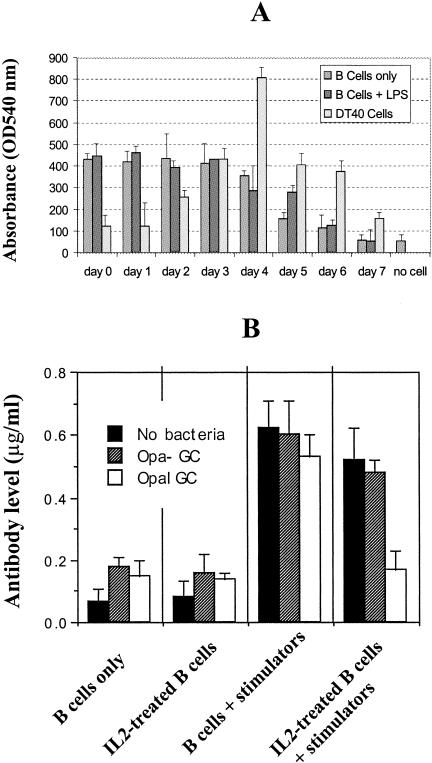
FIG. 2.
Cell proliferation assay and OpaI-induced inhibition of antibody production by CEACAM1-expressing B cells. (A) The B cells collected each day were treated with MTT. Color absorbance (optical density at 540 nm) is directly proportional to the number of surviving cells and was measured by ELISA plate reader. It should be noted that the control cell line, DT40, goes into apoptosis immediately after its growth reaches the peak at day 4. (B) B cells with or without treatment with IL-2 were sorted out from PBMC, then treated with anti-CD40 and -Mμ antibodies (the stimulators), and simultaneously challenged with Opa− or OpaI GC for 72 h. The supernatants were collected, and antibody level was measured by ELISA. The bars (B) represent the means from six experiments, in which each experiment was performed in duplicate or triplicate.

