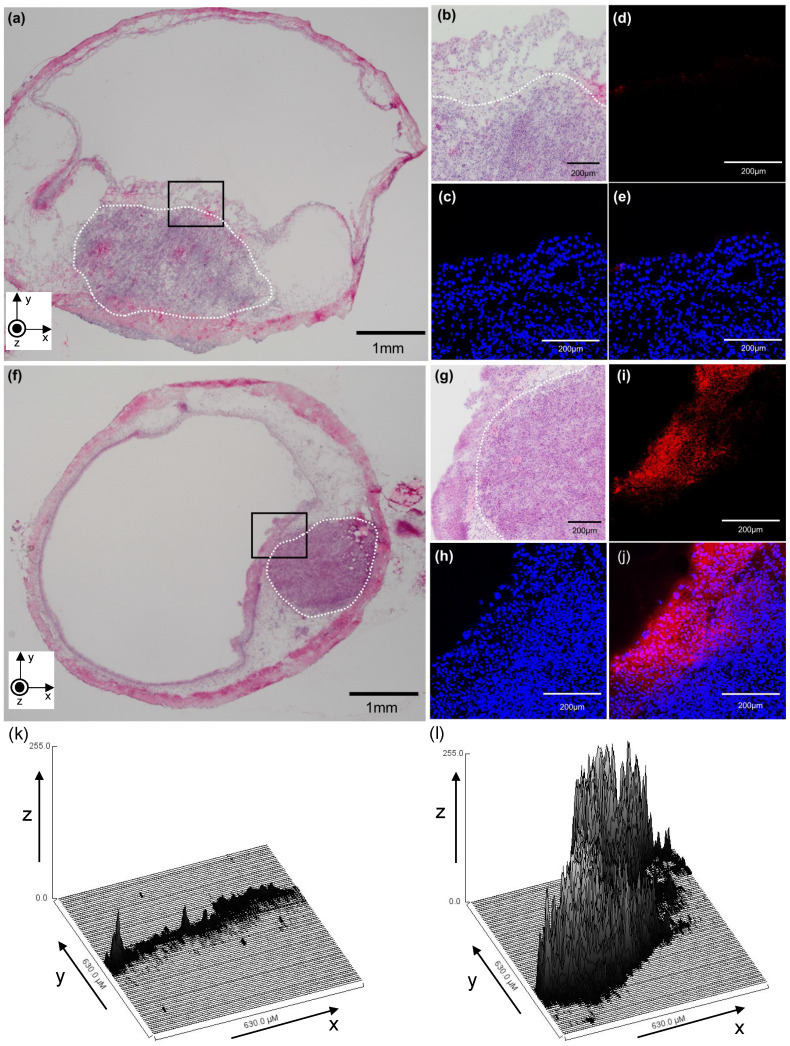
Figure 3.
A representative confocal image (cross-section) of a bladder in which TOTO-3 fluorescence molecules were delivered using microbubbles (MBs) and ultrasound (US). (a-e) MBs and TOTO-3 without US irradiation. (f-j) MBs and TOTO-3 with US irradiation. (a) A section stained with hematoxylin and eosin (HE). The white dotted line indicates a carcinomatous lesion. (b) An HE-stained section of the bladder (black box) shown in (a) with higher magnification. (c) Nuclei of bladder cells (including MBT-2 cells) were stained with 4′,6-diamidino-2-phenylindole (DAPI). (d) TOTO-3 (red) fluorescence shows the location where the molecules are delivered. (e) Merged image. (f) HE-stained section. The white dotted line indicates a carcinomatous lesion. (g) An HE-stained section of the bladder (black box) shown in (f) with higher magnification. (h) DAPI staining. (i) TOTO-3 (red) fluorescence shows the location where the molecules are delivered. (j) Merged image. (k and l) The distribution of red signal intensity converted into 8-bit grayscale values is shown in a three-dimensional plot, where the x-axis and y-axis correspond to the x-y plane shown in (d) and (i), respectively, and the z-axis shows the mean grayscale intensity of the fluorescent molecule at each point in the region of interest.

