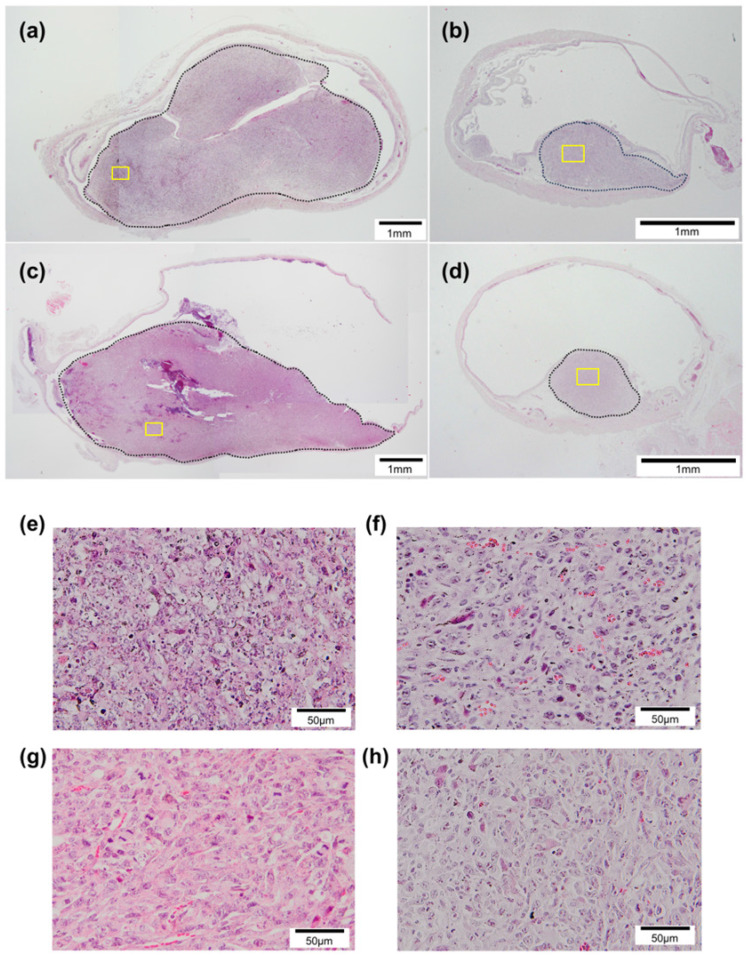
Figure 5.
Histopathological analysis. Sections from each group stained with hematoxylin and eosin. (a) Control, (b) MMC, (c) US + MB, and (d) US + MB + MMC. Panels (e), (f), (g), and (h) show representative microscopic images with higher magnification of panels (a), (b), (c), and (d) (yellow boxes), respectively. The black dotted lines indicate carcinomatous lesions. In the control and US + MB groups, widespread cancerous lesions are observed, whereas relatively small lesions are observed in sections from the MMC and US + MB + MMC groups.

