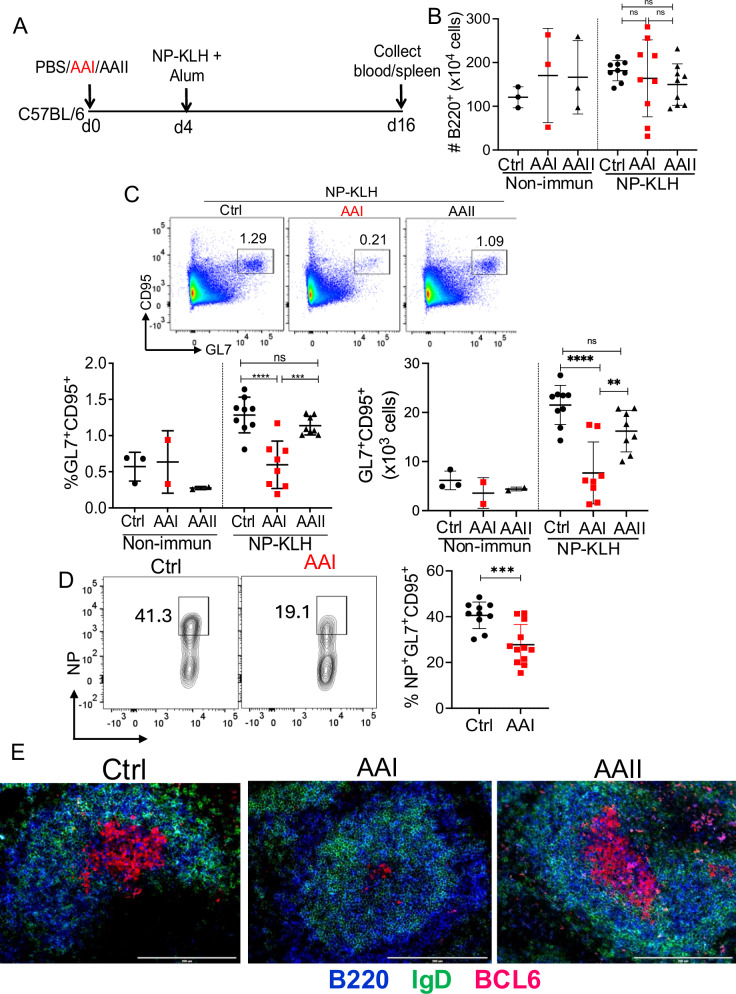
Fig. 1. Impaired GC formation in AAN mice.
A Schematic diagram of the experimental design. C57BL/6 (WT) mice were i.p. injected with a single dose of AAI, AAII (7.5 mg/kg b.wt), or PBS (Ctrl). Mice were either immunized with NP-KLH in alum or left non-immunized 4 days post-AAI injection. At 12 days post-immunization, spleens were assessed for B B cells (liveB220+) [Non-immun: Ctrl (3), AAI (3), AAII (3); NP-KLH: Ctrl (9), AAI (9), AAII (9)] C total GC B cells (liveB220+GL7+CD95+) [Non-immun: Ctrl (3), AAI (2), AAII (2); NP-KLH: Ctrl (9), AAI (8), AAII (8)], D NP-specific GC B cells (liveB220+NP+GL7+CD95+) [NP-KLH: Ctrl (10), AAI (12)] by flow cytometry, and (E) GC formation (n = 3) by immunofluorescence staining of spleen section. Scale bar = 50 μm. Each dot represents individual mice and data are pooled from at least 2–3 independent experiments (B–D). Data expressed as Mean ± SD. Statistical analyses by One-way ANOVA (B, C) and two-sided t-test (D). C Ctrl vs. AAI ****P < 0.0001, AAI vs. AAII ***P = 0.0007 and Ctrl vs. AAI ****P < 0.0001, AAI vs. AAII **P = 0.0060. D *** P = 0.0008. ns: statistically not significant. Source data are provided as a Source Data file.

