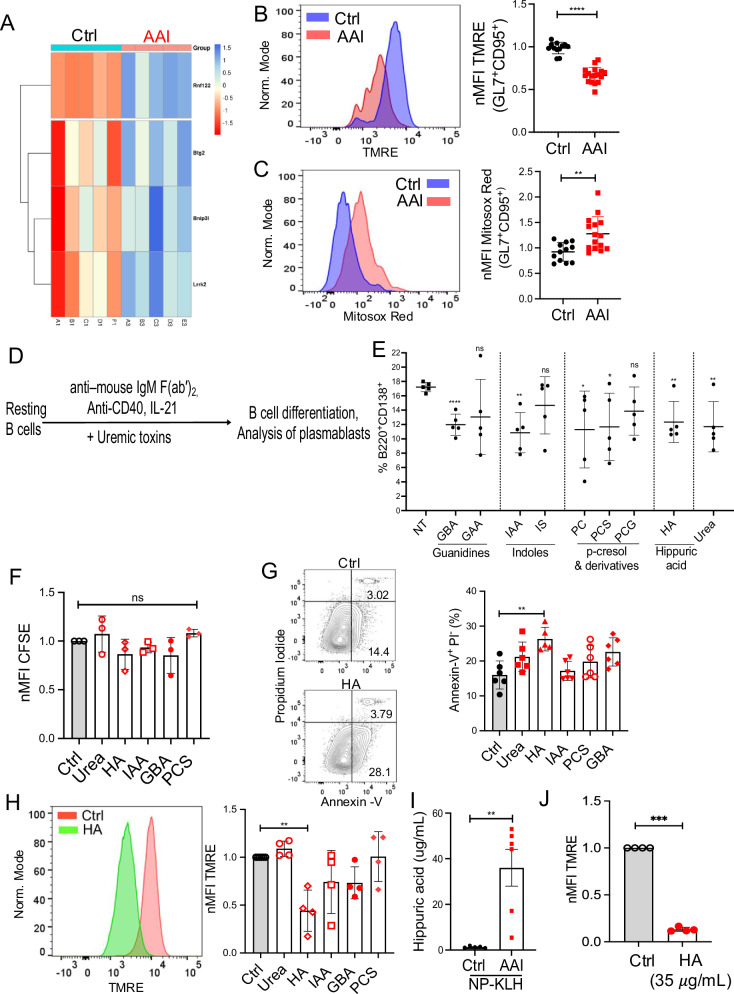
Fig. 5. HA drives loss of mitochondrial membrane potential in B cells.
A NP-specific GC B cells from the control and AAN spleen (n = 5) were flow sorted on day 12 post-immunization for RNA-Seq analysis. Relative expression of significantly differentially expressed genes (q-value < 0.05) related to mitochondrial membrane potential. At day 12 post-immunization, B mitochondrial membrane potential [NP = KLH: Ctrl (12), AAI (17)], and C mitoROS production [NP = KLH: Ctrl (12), AAI (15)] were measured in GC B cells by TMRE and MitoSox Red staining, respectively. D Schematic diagram of in vitro B cell assay. E WT resting splenic B cells (n = 5) ± uremic toxins were stimulated with αIgM/αCD40/IL-21 and the number of B220+CD138+ plasmablasts was determined by flow cytometry at 96 h. WT B cells ± αIgM/αCD40/IL-21 ± uremic toxins and F proliferation (CFSE dilution) of plasmablasts was assessed at 48 h (n = 3), G apoptosis (n = 6), and H mitochondrial membrane potential was measured in plasmablasts at 24 h (n = 4). I HA concentration in the serum of mice was measured by LC-MS/MS [Ctrl (5), AAI (6)]. J WT splenic B cells + αIgM/αCD40/IL-21 ± HA (35 μg/ml) were assessed for the loss of mitochondrial membrane potential in plasmablasts at 24 h. Each dot represents individual mice (B, C, and I) and 5 (E), 3 (F), 6 (G), and 4 (H, J) experiments. Data pooled from 2–3 experiments (B, C, and I). Data expressed as Mean ± SD. Statistical analyses by One-way ANOVA (E–H) and two-sided t-test (B, C, I, and J). B ****P < 0.0001. C **P = 0.0029. E NT vs. GBA ****P < 0.0001, NT vs. IAA **P = 0.0011, NT vs. PC *P = 0.0398, NT vs. PCS *P = 0.0307, NT vs. HA **P = 0.0059, NT vs. Urea **P = 0.0084. G Ctrl vs. HA **P = 0.0019. H Ctrl vs. HA **P = 0.0032. I **P = 0.0037. J ***P = 0.0004. ns: statistically not significant. Source data are provided as a Source Data file.

