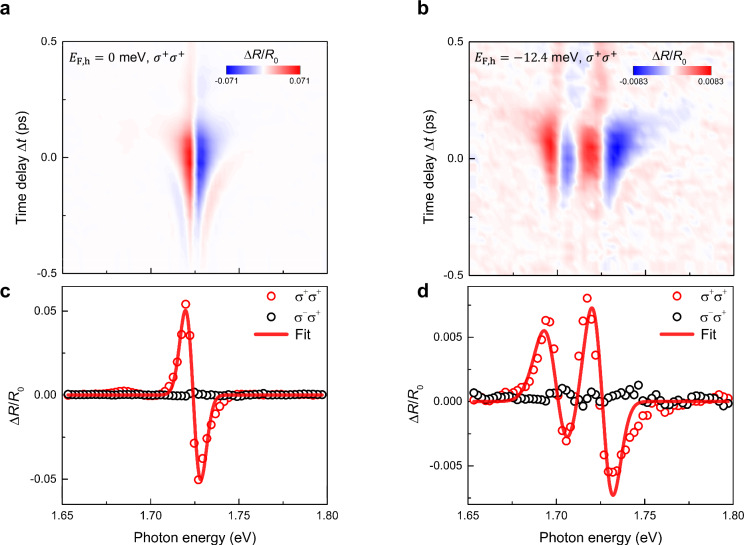
Fig. 2. Valley-selective resonance shifts of excitons and Fermi-polarons.
a A two-dimensional plot when is meV, i.e., the dashed line in Fig. 1c. The σ+-polarized pump (photon energy of 1.55 eV) is incident onto the sample and the pump-induced changes are measured using with σ+-polarized white-light pulses. The data correspond to the conventional optical Stark effects of non-interacting excitons. b The pump-induced spectra when is −12.4 meV. See the dotted line in Fig. 1c. In contrast to a, two oscillatory signals are visible at 1.6981 eV and 1.7303 eV, implying the existence of two oscillator shifts. The former (latter) is attributed to the resonance blueshift due to the attractive (repulsive) Fermi polarons. Data of c and d are the spectrally-resolved at zero time-delay between the pump and probe pulses. The pump and probe pulses are co-circularly polarized (open red circles). No significant spectrum are observed for the cross-circularly polarized pump-probe case, i.e., -polarized pump and -polarized probe (open black circles). Solid red curves are the fit using shifted Gaussian oscillators. We have used a single Gaussian for (c) and two Gaussian oscillators model for (d). For more details on the fits, refer to the Note 4 in the Supplementary Information.

