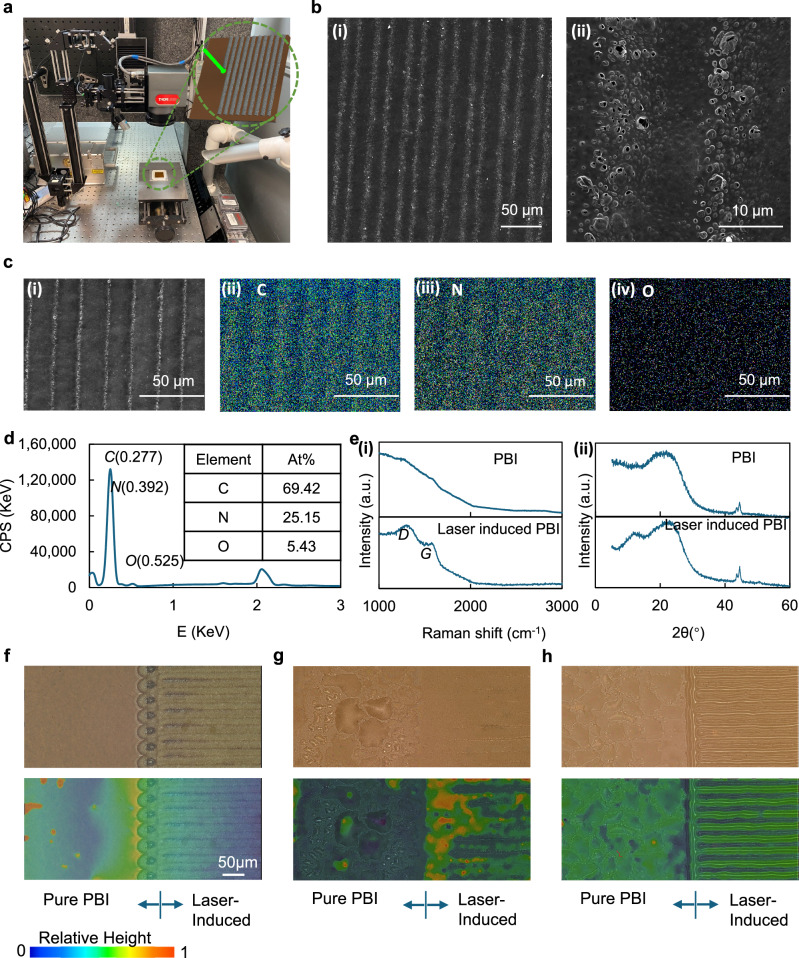
Fig. 1. Laser-induced membrane.
a Laser induction set up. b SEM images (i) large scale and (ii) small scale. c EDX images, (i) SEM image for EDX, (ii) C element, (iii) N element and (iv) O element, d EDX spectrum and elements content, e (i) Raman spectra of PBI membrane and Laser-induced PBI membrane, (ii) XRD spectra of PBI membrane and Laser-induced PBI membrane, f optical microscopy image and depth profile of laser-induced PBI membrane, g optical microscopy and depth profile of PA doped Laser-induced PBI membrane, and h optical microscopy and depth composition profile of laser-induced PA doped PBI membrane.

