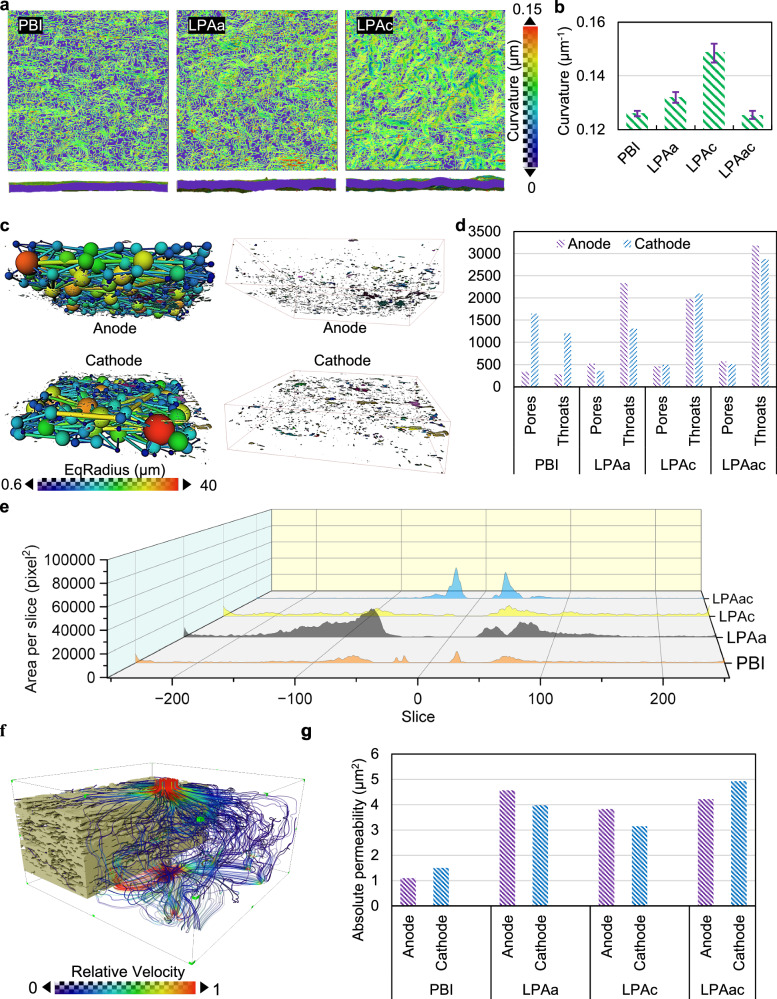
Fig. 4. Pore structure and spatial distribution in MEAs after AST.
a The curvature distribution plots of the membrane. The upper portion consists of surfaces characterized by iso-curvature lines, while the lower portion depicts interface diagrams. Transitioning from purple to red signifies an increase in curvature. b The statistical distribution plot of the average curvature of the membrane. The error bars reflect the variability across different membrane regions and between samples. c The ball-and-stick model of the electrode pores and throat network, along with the distribution plot of isolated pores. d Statistical plots depicting the average number of pores and throats in electrodes across different MEAs. e Slice-by-slice plots of isolated pores of different MEAs. f illuminated streamlines of absolute permeability in the pore area. g statistical plots of absolute permeability for different MEAs’ pore regions.

