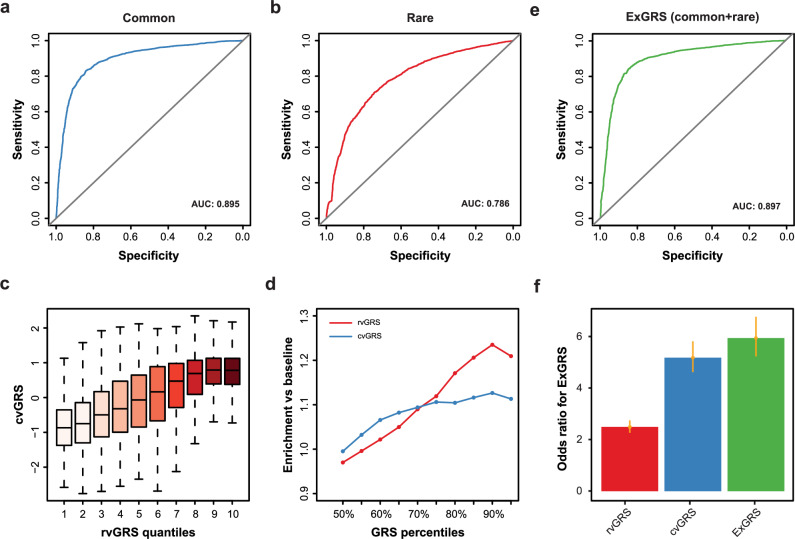
Fig. 4. Compare the GRS of common and rare variants and combine them into a unified ExGRS model.
a Receiver operating characteristic (ROC) curves for cvGRS model to detect HM in the schoolchildren from the MAGIC cohort (n = 5400). The solid black line represents chance-level prediction accuracy. b ROC curves for rvGRS model to detect HM. c cvGRS for each individual according to 10 groups of the validation dataset binned according to the quantiles of the rvGRS. d Enrichment of outlier GRS scores in individuals who are extreme HM prediction risk. GRS ordered from the 50% to the 100% percentile (x axis), and the y axis depicts the enrichment of HM for each of the percentile-defined subgroups in reference to the baseline population. e ROC curves for ExGRS model to detect HM. f Odds ratios for cvGRS, rvGRS and unified ExGRS model by comparing those in the high-risk group with the remainder of the population. Error bars based on confidence intervals (C.I.).

