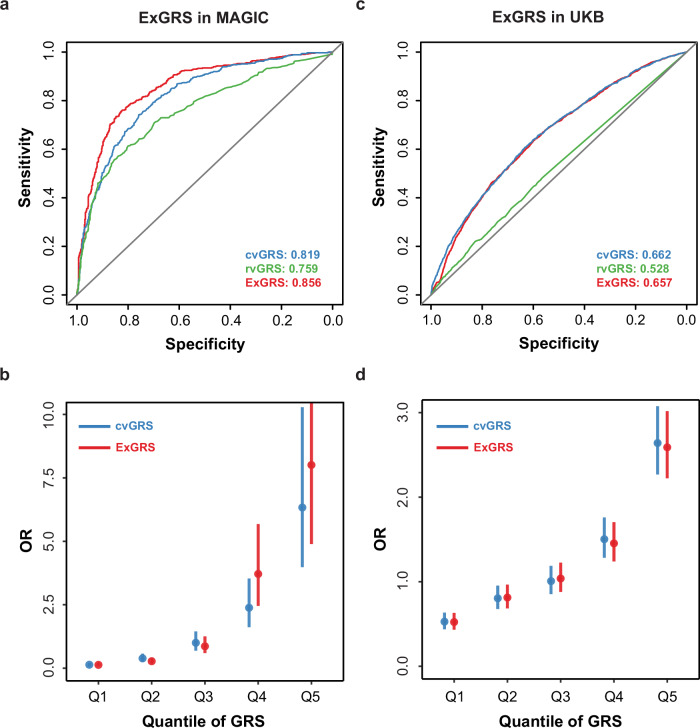
Fig. 5. Effects of the ExGRS for HM in testing cohorts.
a ROC curves and corresponding areas under the ROC curve (AUCs) were used to assess the ability of the ExGRS to distinguish HM in MAGIC testing subgroup (n = 1219). b The x axis depicts each quantile of the ExGRS ordered from the first (Q1) to the last (Q5) quantile. The y axis depicts the ORs of HM for each of the quantile-defined subgroups in reference to the middle quantile (Q3) of cvGRS. The effect estimates (dots) and 95% CIs (vertical bars) were derived based on a fixed-effects in MAGIC testing cohorts. c ROC Curves for detecting HM using ExGRS in UKB testing subgroup of European ancestry (n = 1200). d The effects of the ExGRS in UKB. Error bars based on confidence intervals (C.I.).

