
Figure 2.
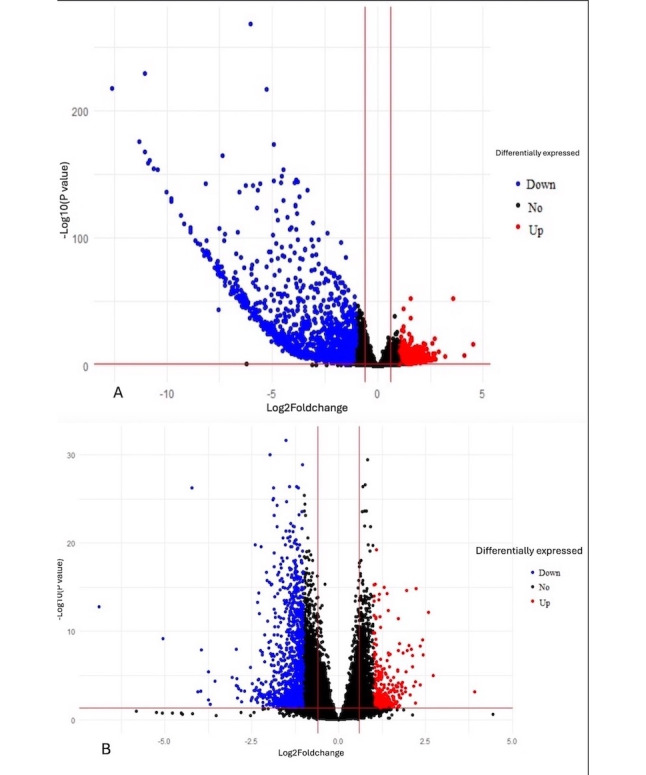
(A) Scatter plot showing genes differentially expressed in the pre-post Heartfulness group comparison. Red and blue dots indicate statistically significant upregulated and downregulated genes. Black dots represent a statistically insignificant differential expression of genes. (B) Scatter plot showing genes differentially expressed in the post-Heartfulness–postcontrol group comparison. Red and blue dots indicate statistically significant upregulated and downregulated genes. Black dots represent a statistically insignificant differential expression of genes.