Figure 3.

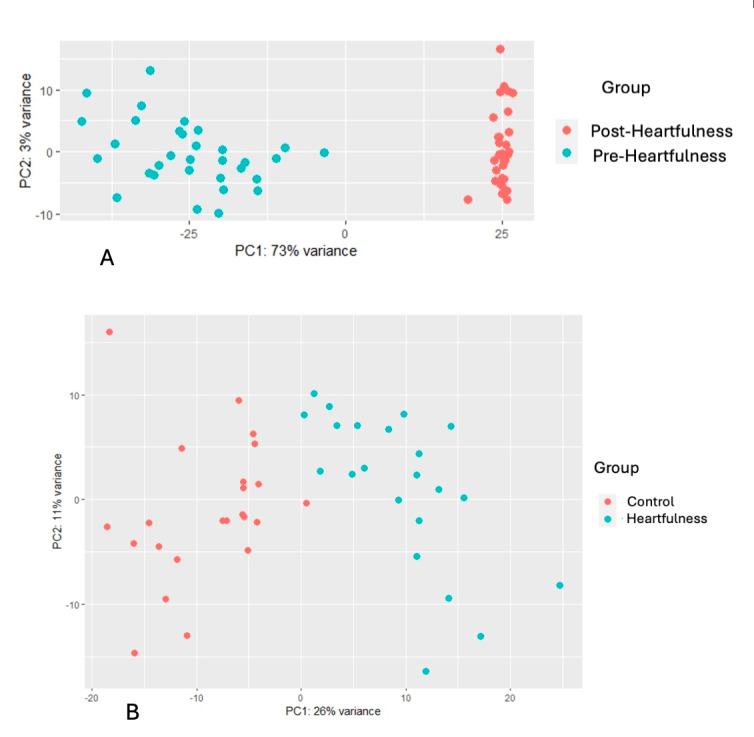
(A) PCA plot of pre- and post-Heartfulness DESeq data, clustering 2 groups separately. The graphical representation of the transcriptome profile includes pre- (0-week; cyan) and post-Heartfulness (12-week; orange) participants. Principal component 1 (PC1) and principal component 2 (PC2) account for 73% (x-axis) and 3% (y-axis) of the variance respectively in expression data. (B) PCA plot of post-Heartfulness and postcontrol DESeq data clustering after removing the outliers. The graphical representation of transcriptome profile of 22 post-Heartfulness (cyan) and 23 postcontrol (12-week; orange) participants, respectively. PC1 and PC2 account for 26% (x-axis) and 11% (y-axis) of the variance respectively in expression data. PCA: principal component analysis.
