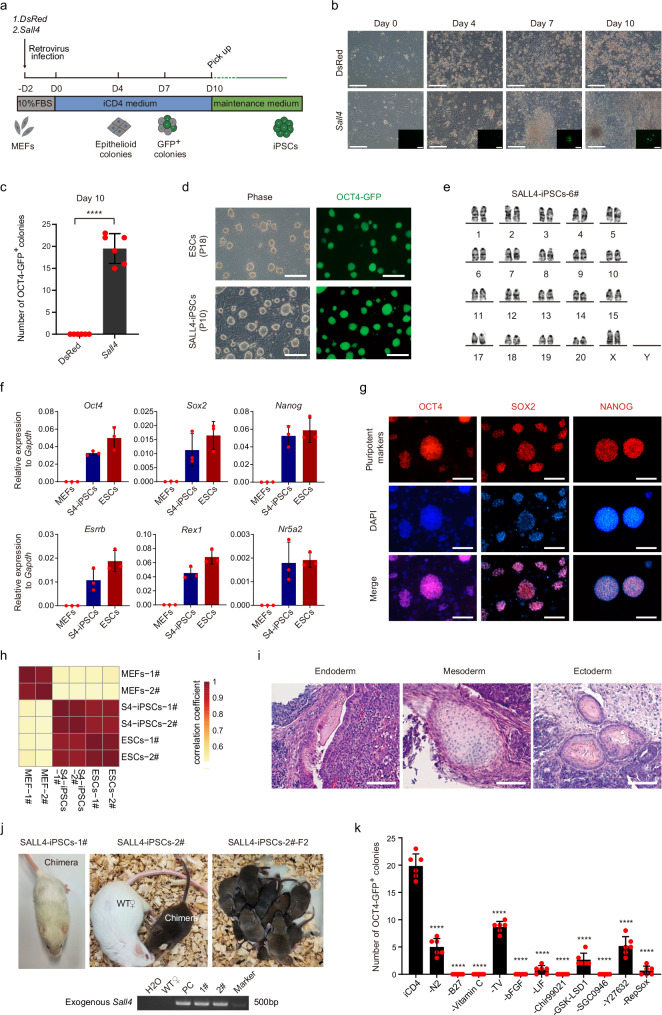
Fig. 1. Generation of iPSCs from MEFs induced by SALL4 and small molecules.
a Schematic of iPSCs induction from mouse fibroblasts using exogenous genes and small molecules. b Morphological diagram for the SALL4-iPSCs induction process. Scale bars, 200 μm. The experiments were repeated independently three times with similar results. c Number of OCT4-GFP+ colonies from 3 × 10⁴ MEFs infected with Sall4 or DsRed in iCD4 on Day 10. MEFs infected with DsRed as control are shown. Data are mean ± SD. Statistical analysis was performed using a two-tailed, unpaired t test; n = 6 well from 3 independent experiments. ****p = 0.0000325. d The morphology of Passage10 iPSCs colonies derived from MEFs by overexpressed Sall4 in iCD4. ESCs as control are shown. Scale bars, 200 μm. The experiments were repeated independently three times with similar results. e The normal karyotype for SALL4-iPSCs. f qRT-PCR analysis of pluripotency markers in SALL4-iPSCs. Data are mean ± SD; n = 3 biological replicates. S4, SALL4. g Immunofluorescence analysis of pluripotency markers in SALL4-iPSCs. Scale bars, 200 μm. The experiments were repeated independently three times with similar results. h Correlation analysis for RNA-seq from SALL4-iPSCs, MEFs, and ESCs. n = 2 biological replicates. S4, SALL4. i The three germ layers of a teratoma from SALL4-iPSCs. Entoderm, Glandular duct tissue. Mesoderm, chondrocyte. Ectoderm, skin tissue. Scale bars, 100 μm. The experiments were repeated independently three times with similar results. j Chimera mice with Germline transmission from SALL4-iPSCs (top) and genotype identification for exogenous Sall4 in chimeras by PCR (bottom). PCR are using the pMXs-Sall4 plasmid as positive control (PC). The experiments were repeated independently three times with similar results. k Drop-out of individual components during SALL4-induced iPSCs reprogramming. Data are mean ± SD. Statistical analysis was performed using a two-tailed, unpaired t test; n = 6 well from 3 independent experiments. iCD4 versus -N2, ****p = 0.0000003; iCD4 versus -B27, ****p = 0.0000038; iCD4 versus -Vitamin C, ****p = 0.0000038; iCD4 versus -TV, ****p = 0.0000099; iCD4 versus -bFGF, ****p = 0.0000038; iCD4 versus -LIF, ****p = 0.0000009; iCD4 versus -Chir99021, ****p = 0.0000038; iCD4 versus -GSK-LSD1, ****p = 0.0000003; iCD4 versus -SGC0946, ****p = 0.0000038; versus -Y27632, ****p = 0.0000003; iCD4 versus -RepSox, ****p = 0.0000006. TV, Thiamine HCl + Vitamin B12.

