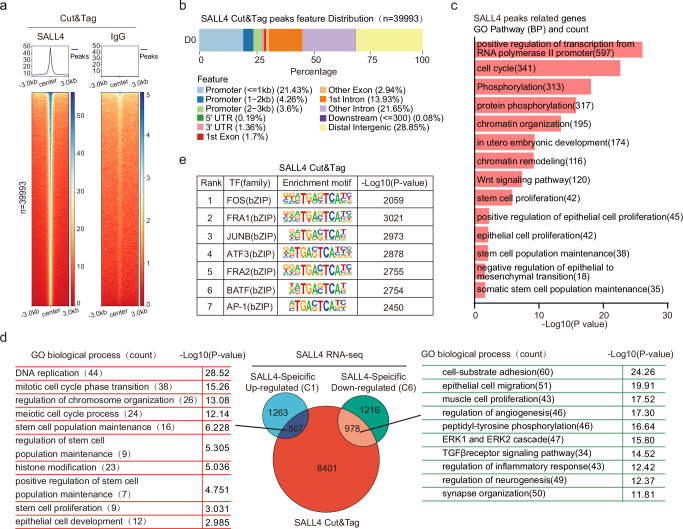
Fig. 2. SALL4 binding the genomic locus to activating and silencing reprogramming-related genes.
a Heatmap of Cut&Tag data at D0 from IgG and SALL4, respectively, showing all binding peaks centered on the peak region within a 3 kb window around the peak. b Genome distribution of the location for SALL4-occupied peaks relative to the nearest annotated gene. c GO biological processes analysis for genes near the SALL4-TSS loci binding peaks. Statistical analysis was performed using Fisher’s exact test, the -Log10(p-value) for each term is shown. d Left, representative GO biological processes analyzed by the up-regulated overlapping genes. Right, representative GO biological processes are analyzed by the down-regulated overlapping genes. Middle, overlapping genes compared by CUT&Tag and RNA-seq data. Statistical analysis for GO was performed using Fisher’s exact test, the -Log10(p-value) for each term is shown. e Transcription factor motif enrichment of SALL4-binding peaks. Statistical analysis was performed using Karlin/Altschul statistics, and the -Log10(p-value) for the motif is shown.

