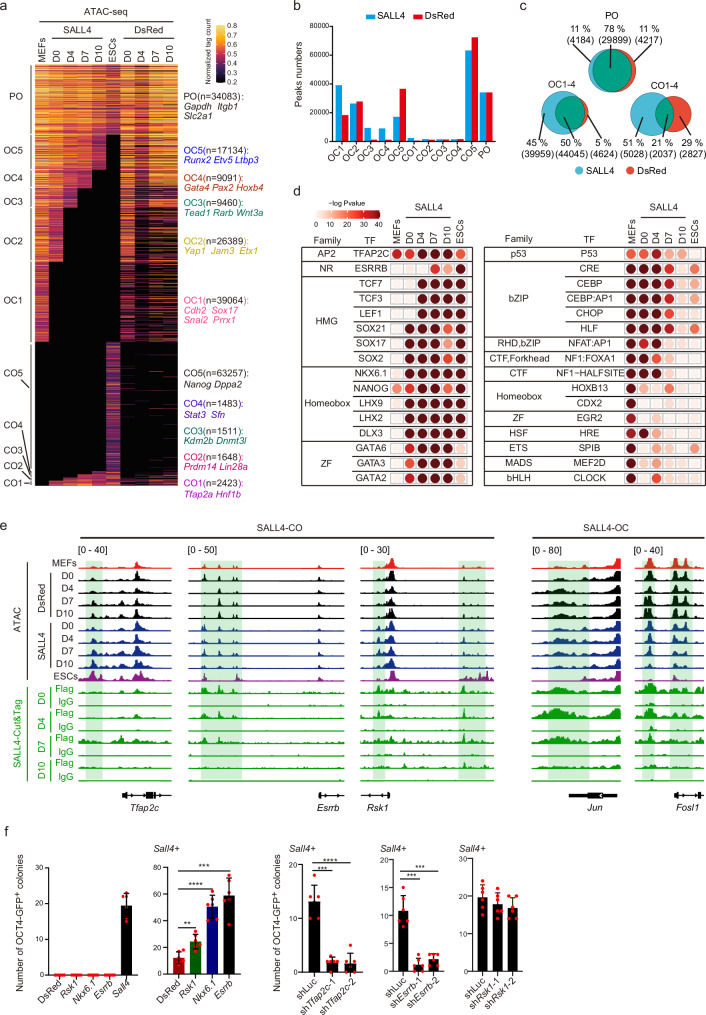
Fig. 3. Chromatin accessibility dynamics during SALL4-iPSCs induction.
a CADs for SALL4 system and DsRed system. PO, permanently open. CO, close to open. OC, open to close. Take the DsRed system as a reference is shown. b The histogram shows the number of peaks for CO, OC, and PO subgroups of the SALL4 system and DsRed system. SALL4, SALL4 system. DsRed, DsRed system. c Venn diagrams show the overlapping number and factor-specific number of CO1-4, OC1-4, and PO peaks between the SALL4 system and the DsRed system. SALL4, SALL4 system. DsRed, DsRed system. d Motif analysis of the SALL4-specific enrichment peaks at D0, D4, D7, and D10 during iPSCs induction, the peaks for each day in the DsRed system as a background was removed from the peaks at D0, D4, D7, and D10 in SALL4 system. Statistical analysis was performed using Karlin/Altschul statistics, and the -Log10(p-value) for the motif is shown. SALL4, SALL4 system. e Representative Genomic loci and genes for SALL4-specific close-to-open (SALL4-CO) peaks, SALL4-specific open-to-close (SALL4-OC) and SALL4-binding peaks (Cut&Tag data). f The iPSCs induction efficiency using SALL4 overepressing with representative SALL4-occupied gene Esrrb, Rsk1, and ATAC-seq motif-enriched gene Nkx6.1. The reprogramming efficiency induced by Sall4 when knocking down Tfap2c or Esrrb(right). Data are mean ± SD. Statistical analysis was performed using a two-tailed, unpaired t test; n = 6 well from 3 independent experiments. Sall4 + DsRed versus Sall4 + Nkx6.1, ****p = 0.0000162; Sall4 + DsRed versus Sall4 + Esrrb, ***p = 0.0001515; Sall4 + DsRed versus Sall4 + Rsk1, **p = 0.0019697; Sall4 + shTfap2c-1 versus Sall4 + shLuc, ***p = 0.0001119; Sall4 + shTfap2c-2 versus Sall4 + shLuc, ****p = 0.0000343; Sall4 + shEsrrb-1 versus Sall4 + shLuc, ***p = 0.0001059; Sall4 + shEsrrb-2 versus Sall4 + shLuc, ***p = 0.0002597. shLuc, shLuciferase.

