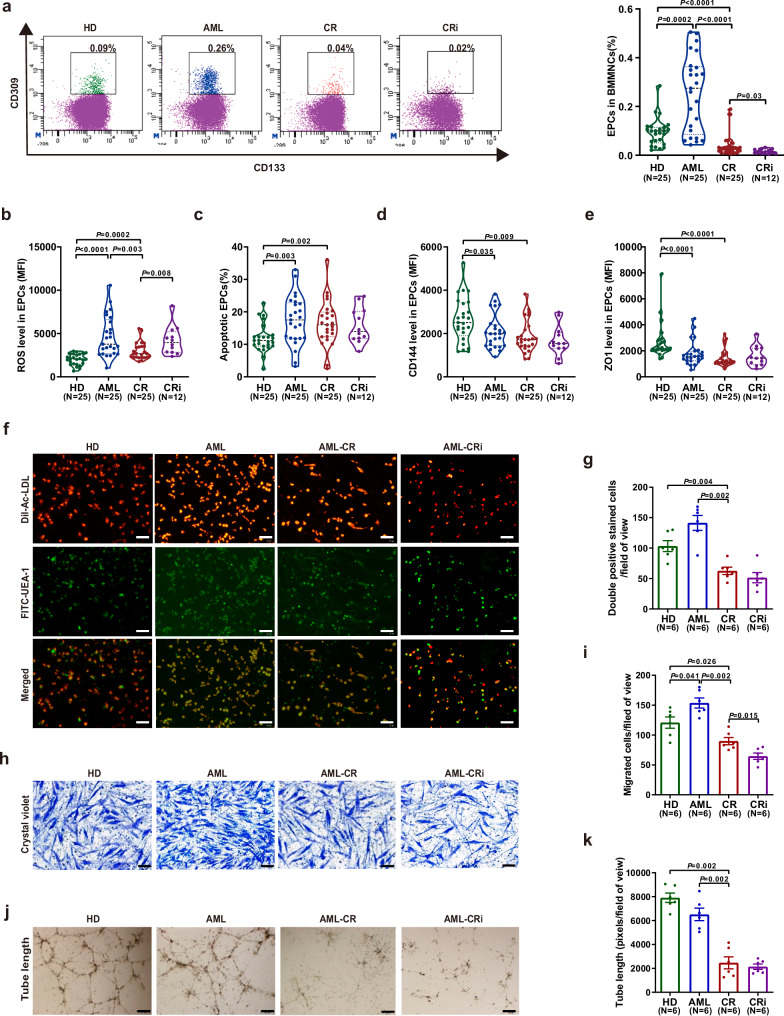
Fig. 1. The number and functions of bone marrow (BM) endothelial progenitor cells (EPCs) from complete remission (CR) patients were partially remodeled to those of normal BM EPCs compared to de novo acute myeloid leukemia (AML) patients.
a, left The EPC phenotype was characterized by CD34+CD309+CD133+, as determined by flow cytometry. a, right The percentage of BM EPCs in precultivated BM mononuclear cells (BMMNCs) was analyzed. b The ROS levels, c apoptosis ratio, d CD144 level and e ZO1 level in precultivated BM EPCs from HDs (N = 25), patients with AML (N = 25), CR (N = 25) and CRi (N = 12). b–e Twenty-five paired samples from each of the groups (N = 25 per group, n = 1 per sample) were collected on different days, with one sample per group analyzed together on the same day. CRi group(N = 12, n = 1) was performed during the revision. f Representative images (scale bar = 200 µm) of typical cultured BM EPCs collected on day 7 of culture were characterized by double-positive staining (merged in yellow) with DiI-Ac-LDL (red) and FITC-labeled Ulex Europaeus Agglutinin-I (FITC-UEA-I) (green) (original magnification, 10×). g Quantification of double-positive EPCs/field of view (merged in yellow) stained with DiI-Ac-LDL (red) and FITC-UEA I (green) on day 7 of culture (original magnification, 10×) h After 7 days of culture, BM EPCs were cultured in a transwell chamber for 24 h, fixed and stained with crystal violet. Representative images (scale bar = 200 µm) and i the number of migrated cells per field of view on the bottom surface of the membrane (original magnification, 10×) Three power fields were randomly counted, and the values were averaged for each sample. j Representative images (scale bar = 200 µm) of tube formation (pixels of tubes per field of view) and k quantification of the tube length of BM EPCs after 7 days of culture (original magnification, 10×). f–k Six paired samples from each of the groups (N = 6 per group, n = 3 per sample) were collected on different days, with one sample per group analyzed together on the same day. N represents biological replicates; n represents technical replicates. Statistical analyses were performed using the Mann–Whitney U test. The data are presented as the means ± SEMs. The statistical tests were two-sided and no adjustments were made for multiple comparisons. Source data are provided as a Source Data file.

