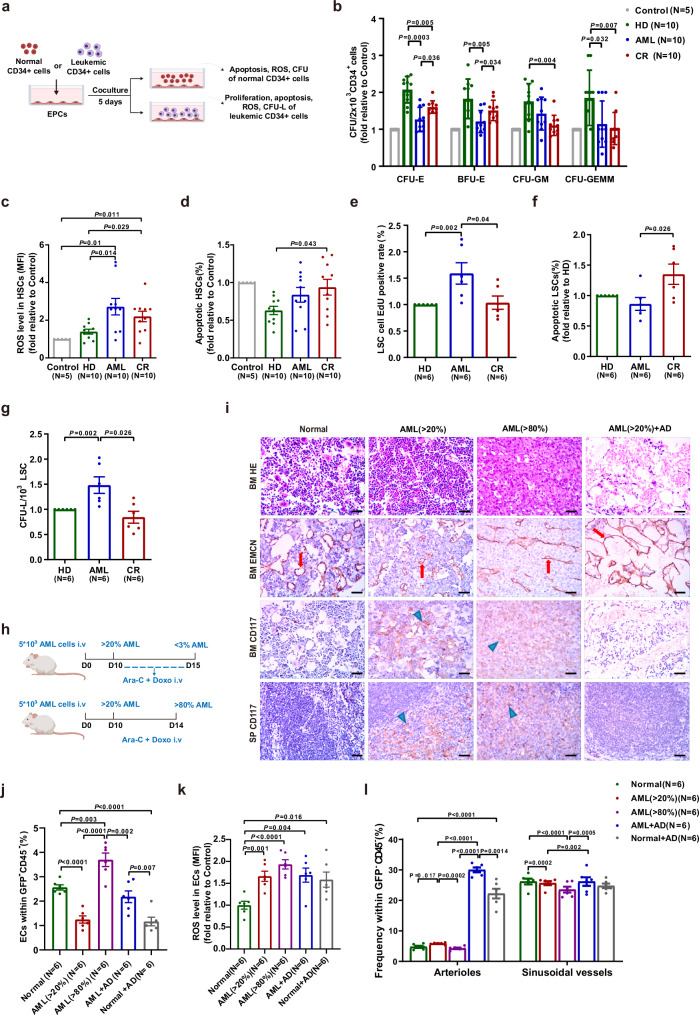
Fig. 2. The hematopoiesis-supporting ability of BM EPCs from CR patients was remodeled compared to that from AML patients, and BM vasculature and EC function were remodeled in AML mice after chemotherapy.
a Schematic diagram of the study design for the process of coculturing BM EPCs with HSCs or leukemic CD34+ cells. b The CFU plating efficiency of HSCs, as determined by colony-forming unit (CFU), burst-forming unit erythroid (BFU-E), colony-forming unit granulocyte/macrophage (CFU-GM), and colony-forming unit granulocyte, erythroid, macrophage and megakaryocyte (CFU-GEMM), after coculture with BM EPCs from HDs, patients with AML and CR (N = 10 per group, n = 3 per sample). Quantification of c ROS levels and d the apoptotic ratio of HSCs after coculture with BM EPCs are shown (N = 10 per group, n = 1 per sample). Quantification of e the percentages of EdU-positive f apoptosis ratio, g leukemia colony-forming units (CFU-L) of leukemic CD34+ cells after coculture with BM EPCs are shown (N = 6 per group, n = 1 per sample). b–g The paired samples from each of the groups were collected on different days, with one sample per group analyzed together on the same day. h Schematic diagram of the design of the study of AML mouse model. i Femoral sections stained with HE, an anti-endomucin (EMCN) antibody (red arrow) and a CD117 antibody (blue arrow). Representative images showing increased and structurally disordered vessels in the AML mice at primary disease stages ( > 20% BM infiltration, AML ( > 20%)), compressed vessels at advanced disease stage ( > 80% BM infiltration, AML ( > 80%)) and dilated vessels after chemotherapy (AML + AD mice) compared to those in the normal group (Normal). The AML + AD group showed completely cleared CD117+ cells (brown) in the BM and spleen (SP) (scale bar=10 µm). j The frequency of CD31+VE-cadherin+ ECs within the CD45-Ter119- BM cells from mice given the indicated treatments was analyzed by flow cytometry. k Quantification of intracellular ROS levels in BM ECs among all the mouse groups. l Quantification of subtypes BM ECs among all the mouse groups. j–l The paired samples from each of the murine groups (N = 6 per group, n = 1 per sample) were collected and analyzed at indicated days. N represents biological replicates; n represents technical replicates. Statistical analyses were performed using the Mann–Whitney U test and unpaired t test. The data are presented as the means ± SEMs. The statistical tests were two-sided and no adjustments were made for multiple comparisons. Source data are provided as a Source Data file.

