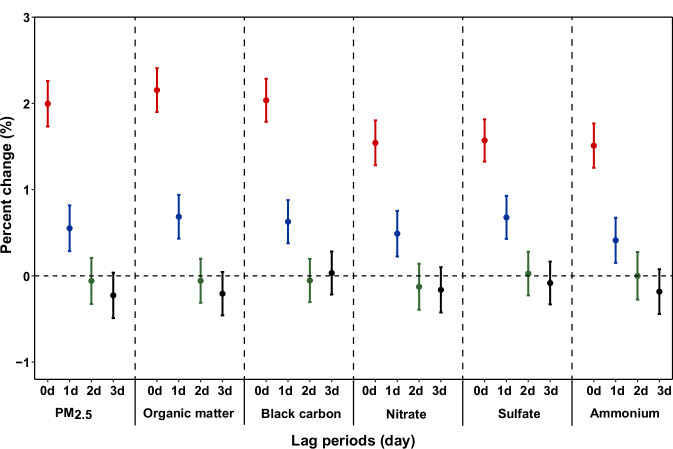
Fig. 1. Percent changes in the risk of ACS onset per interquartile range increase in concentrations of PM2.5 total mass and its chemical constituents.
Dots are the estimated percent changes of ACS onset associated with an interquartile range increase in concentrations of PM2.5 total mass and its chemical constituents, and error bars indicate 95% confidence intervals. The x-axis labels specify the corresponding lag days (0, 1, 2, and 3 days) for each estimate. A total of 2,113,728 participants were included in the analysis. Source data are provided as a Source Data file. Abbreviations: ACS, acute coronary syndrome; PM2.5, fine particulate matter.

