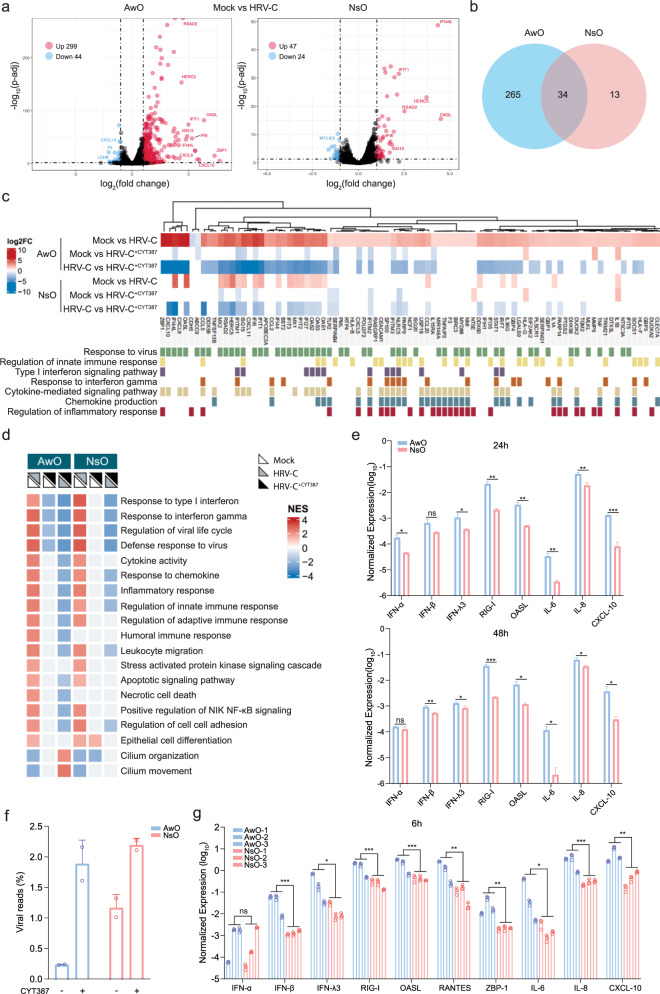
Fig. 5. Host transcriptional response in human airway and nasal organoids.
HRV-C3 infected airway organoids (AwO) and nasal organoids (NsO) treated with CYT387 (HRV-C+CYT387) or DMSO (HRV-C), together with mock-infected organoids (Mock) were applied to RNA sequencing analysis. a Volcano plot shows DEGs in the infected airway and nasal organoids compared with mock-infected organoids. DEGs with a log2(fold change) > 1 and < −1 are shown in red and blue, respectively. b Venn diagram shows the numbers of unique and common upregulated DEGs in the infected airway and nasal organoids. c Heatmap depicts DEGs in the indicated organoids and the assigned GO biological processes (GO:0009615, GO:0045088, GO:0060337, GO:0034341, GO:0019221, GO:0032602, GO:0050727). d The heatmap demonstrates the enriched GO terms in the indicated airway and nasal organoids. The color of the dots represents the normalized enrichment score (NES) value for each enriched GO term. e GAPDH normalized expression levels of innate immune molecules in HRV-C3-infected airway and nasal organoids at 24 and 48 h.p.i (n = 3). f Data show the percentage of virus-aligned reads over total reads in the indicated organoids (n = 2). g Three lines of airway and nasal organoids were treated with 10 μg/ml Poly(I:C) or mock-treated (n = 3). At 6 h post-treatment, organoids were harvested for RT-qPCR. Results show the GAPDH normalized expression level of innate immune molecules in the airway and nasal organoids. Data represent mean and SD of the indicated number (n) of biological replicates from a representative experiment. Statistical significance (in e, g) was determined using a two-tailed Student’s t-test. *P < 0.05, **P < 0.01, ***P < 0.001. ns not significant. Source data are provided as a Source Data file for Fig. 5e, g.

