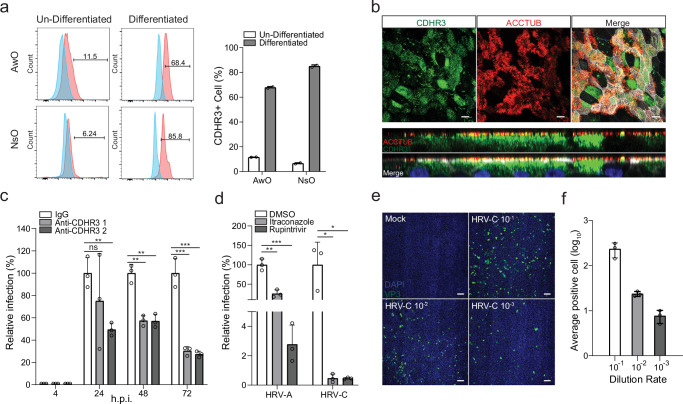
Fig. 6. Receptor blocking, antiviral inhibition, and virus titration in airway and nasal organoids.
a Airway (AwO) and nasal organoids (NsO) and their un-differentiated counterparts were immune-stained with an α-CDHR3 and an isotype IgG control and applied to flow cytometry analysis (n = 2). The left panel shows the representative histograms. b Nasal organoids were fixed and double-stained with an α-CDHR3 (green), α-ACCTUB (red). Confocal images of en face (top) and cross-section (bottom) are shown. Nuclei and actin filaments were counterstained with DAPI (blue) and Phalloidin-647 (white), respectively. Scale bar, 10 µm. c Nasal organoids were treated with two α-CDHR3 of 20 μg/ml and autologous IgG for 2 h (n = 3), followed by HRV-C3 inoculation and further incubation with the same antibodies. Culture media were harvested at the indicated h.p.i. to detect viral replication. Results show the relative viral load in the α-CDHR3 treated organoids versus those in IgG-treated organoids. d Airway organoids infected with HRV-A1 or HRV-C3 were treated with 1 μM Rupintrivir or 3 μM Itraconazole or DMSO (n = 3). Culture media were harvested from the infected organoids at the indicated h.p.i. and applied to the detection of viral replication by RT-qPCR. Results show the relative viral load in the drug-treated organoids versus those in DMSO-treated organoids. e, f Nasal organoids were infected with HRV-C3 after 10-fold serial dilutions (10−1 ~ 10−3). At 24 h.p.i., the organoid monolayers were fixed and immune-stained with an α-VP3, followed by imaging analysis. e Representative high-content confocal images show the VP3+ cells (green) in the monolayers infected by serially-diluted viruses. Nuclei were stained with DAPI (blue). Scale bar, 100 µm. f Three different areas in each organoid monolayer were randomly selected for calculating VP3+ cells. The results show the average number of VP3+ cells at different dilutions. Data represent mean and SD of the indicated number (n) of biological replicates from a representative experiment. Statistical significance (in c, d) was determined using a two-tailed Student’s t-test. *P < 0.05, **P < 0.01, ***P < 0.001. ns not significant. The experiments in b and e were performed three times independently with similar results. Source data are provided as a Source Data file for Fig. 6a, c, d, and f.

