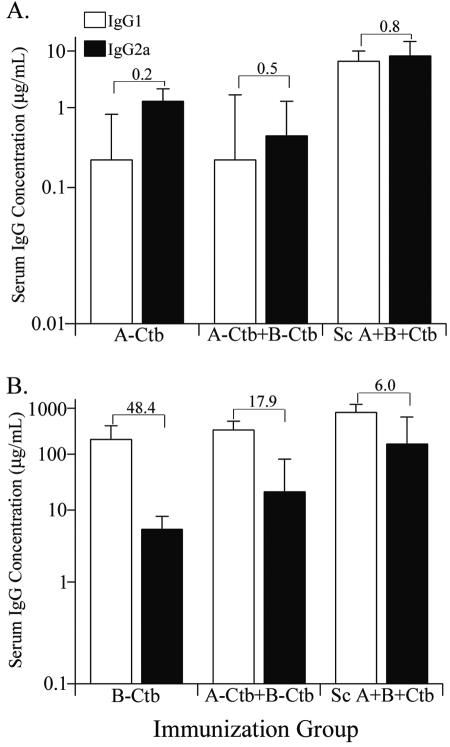
FIG. 3.
IgG1 and IgG2a subtype analysis. (A) IgG1 and IgG2a antibody levels specific for TbpA detected in sera collected at day 35. (B) IgG1 and IgG2a antibody levels specific for TbpB detected in sera collected at day 35. The bars represent the geometric mean ×/÷ standard deviation. The values above the bars represent the IgG1/IgG2a ratios of the corresponding immunization groups, indicated below each graph. For all groups, n = 5.

