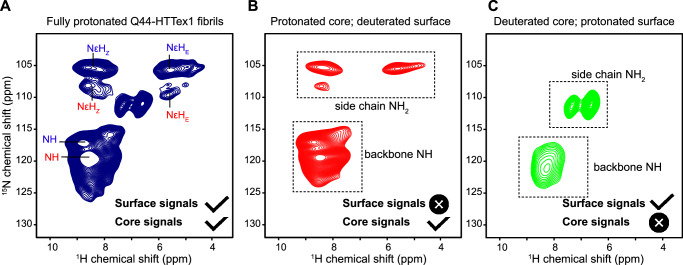
Fig. 5. NMR analysis of polyQ core and surface residues based on H–D exchange.
A 2D 1H-detected 1H–15N HETCOR NMR spectrum of fully protonated Q44-HTTex1 fibrils. The peak labels are color-coded based on the conformer type (“a” = red; “b” = blue), corresponding to the amyloid core assignments from Supplementary Fig. 7. Attenuation of peaks from the “a”-conformer side-chains is attributed to different dynamics (see also Supplementary Fig. 15D). B Analogous data for surface-deuterated Q44-HTTex1 fibers, which are expected to only show peaks from the fibril core. C Analogous 2D spectrum for core-deuterated, surface-detected Q44-HTTex1 fibers, which reveals distinct signals from residues on the polyQ surface. The most dramatic difference is seen for the side chain NH2 group. Measurements at 700 MHz using 60-kHz MAS, at 253 K setpoint temperature. See also Supplementary Fig. 15 for additional data and relaxation measurements. Source Data files provided in ref. 85.

