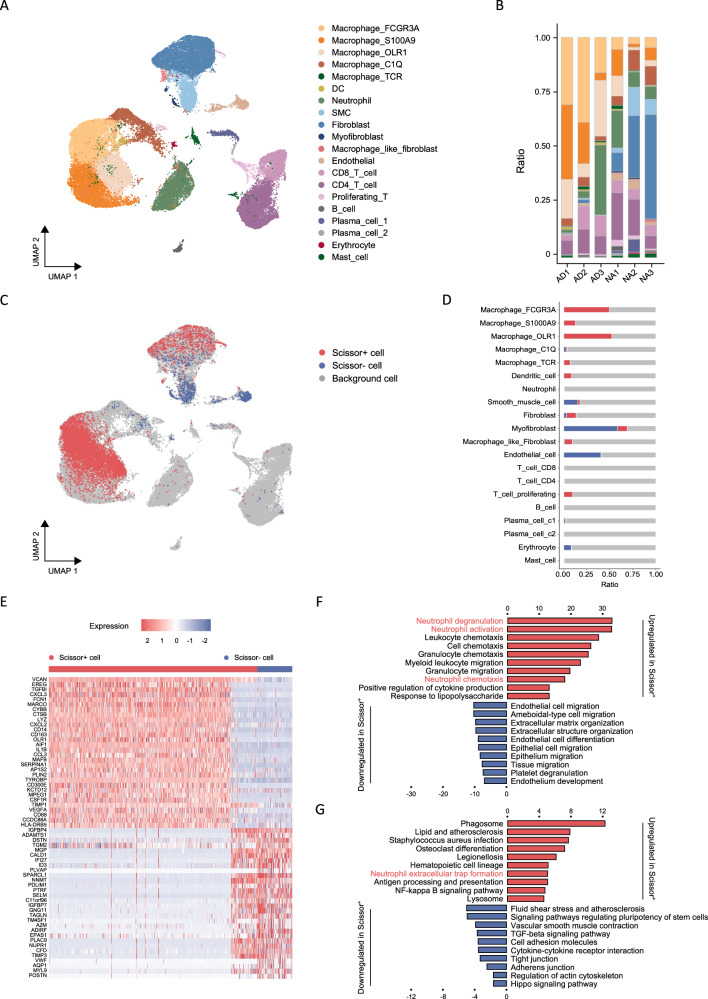
Fig. 2. A phenotype-associated macrophage subset orchestrates neutrophil within aortic microenvironment.
A UMAP representation of aligned gene expression data in single cells extracted from healthy aortas (n = 28,428) and dissected aortas (n = 18,875) showing partition into 20 distinct clusters. B Histogram indicating the proportion of cells in aortic tissue of each analyzed patient with AD (n = 3) and healthy individual (n = 3). C UMAP visualization of the Scissor-selected cells across cell populations. D Histogram indicating the proportion of Scissor-selected cells in aortic tissue of each analyzed patient with AD and healthy individual. E A heatmap plot of differential gene expressions in Scissor+ cells versus Scissor− cells. F A bar plot of the GO enrichment of biological processes showing the significantly enriched pathways in Scissor+ cells. G A bar plot of the KEGG enrichment showing the significantly enriched pathways in Scissor+ cells. AD: aortic dissection; SMC: smooth muscle cell; DC: dendric cell; FCGR3A: Fc fragment of IgG receptor 3a; S100A9: S100 calcium binding protein A9; OLR1: oxidized low density lipoprotein receptor 1; UMAP: uniform manifold approximation and projection.

