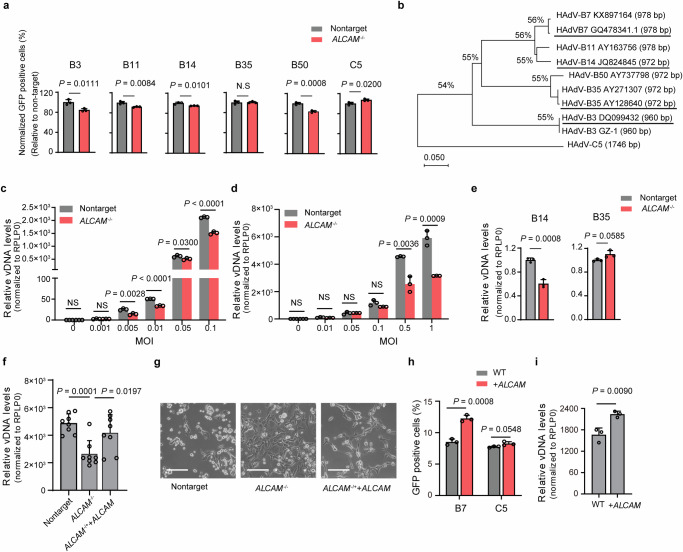
Fig. 3. Characterization of ALCAM as a widely used host factor for HAdV-B and clinical isolates.
a Flow cytometry analysis of the GFP positive ratio in the competition asssay. WT cells are mixed with non-targeting or ALCAM-/- cells and infected with HAdV-C5/B7 or HAdV-C5 for 48 h. The infection rate of each chimeric viruses in ALCAM-/- group is normalized to that in non-targeting sgRNA group. b Phylogenetic analyses of the clinical isolates of HAdV-B3 and -B7 using fiber gene as the reference. The clinical isolates used in this study are HAdV-B3 (GenBank: DQ099432.4), -B7 (GenBank: GQ478341.1), -B14 (GenBank: JQ824845) and -B35 (GenBank: AY128640.2), as highlighted. qPCR quantification of HAdV DNA levels in non-targeting sgRNA mock and ALCAM-/- cells at 48 h post infection with clinical HAdV-B3 (c) and HAdV-B7 (d). e qPCR quantification of HAdV-B14 and -B35 L5 DNA levels in non-targeting sgRNA mock and ALCAM-/- cells at 48 h post infection with HAdV-B14 and HAdV-B35 clinical isolates. f qPCR quantification of HAdV-B7 L5 DNA levels in non-targeting sgRNA mock, ALCAM-/- and overexpression-rescued cells at 48 h post virus infection. g Representive images of the CPEs in non-targeting sgRNA mock, ALCAM-/- and overexpression-rescued cells at 48 h post infection with clinical HAdV-B7. Scale bars, 100 μm. The experiment is repeated three times independently and similar results are obtained. h The effects of ALCAM overexpression on HAdV-C5/B7-GFP infection in Hela cells, as evaluated by flow cytometry quantification of GFP fluorescence. i qPCR quantification of viral L5 DNA levels in WT and ALCAM-overexprssed HeLa cells at 48 h post infection with clinical HAdV-B7. For (c–f and i), rplp0 is used as an internal control. For (a, c–f and h, i), data are presented as mean ± SD (n ≥ 3) from independent biological replicates. For (c), the p values between non-targeting sgRNA mock and ALCAM-/- cell at an MOI of 0.01 and 0.1 are 1e-5 and 5e-5 respectively. The significant difference is analyzed by two-tailed unpaired Student’s t test. Source data are provided as a Source Data file.

