FIGURE 2.

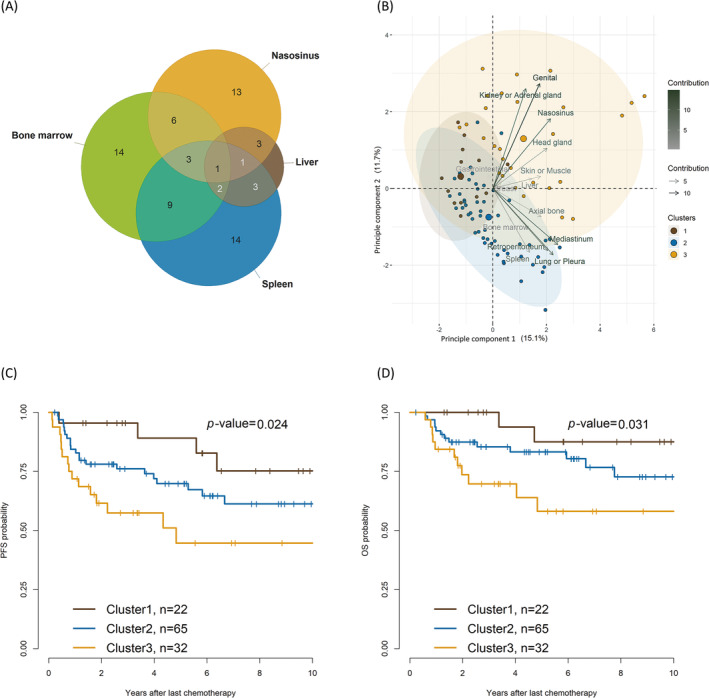
Distribution of extranodal sites in patients with stage IV diffuse large B‐cell lymphoma. (A) Venn diagram of involved organs with unfavorable overall survival in univariate analysis. (B) Biplot based on principal component analysis. The relative contributions of the involved sites on the x and y axes are indicated by an arrow with a gradient. Patients in three clusters categorized using a hierarchical clustering algorithm are shown as points. (C) Kaplan–Meier survival curve showing progression‐free survival of the three clusters, and (D) Kaplan–Meier survival curve showing overall survival of the three clusters.
