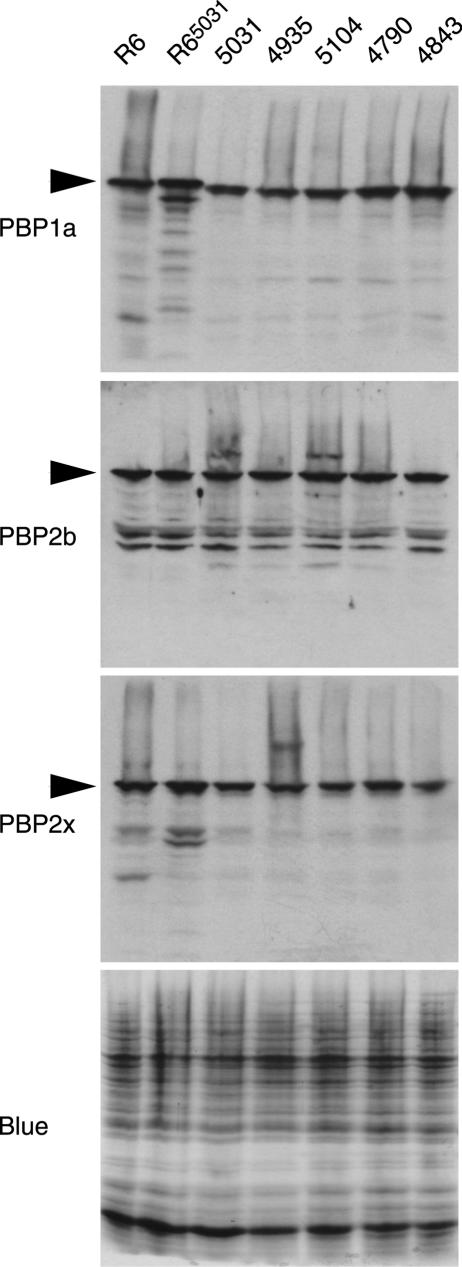
FIG. 1.
Comparison by immunoblotting of the expression of PBP 1a, PBP 2b, and PBP 2x in strains R6, R65031, 5031, 4935, 5104, 4790, and 4843. The Coomassie blue-stained gel shows that equivalent amounts of proteins were analyzed for each strain. The intense band at the bottom is the lyzosyme added to the lysis buffer.

