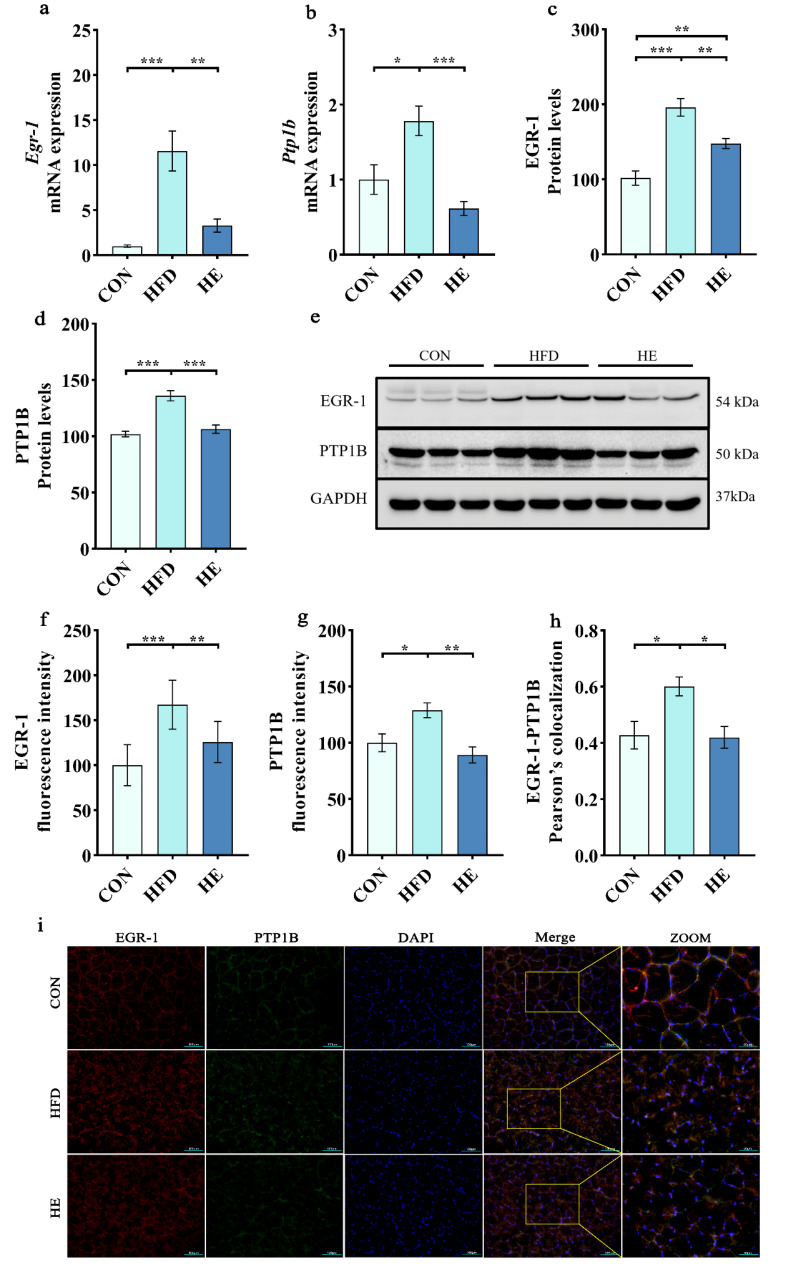
Fig. 5.
Aerobic exercise inhibited EGR-1/PTP1B mRNA and protein expressions in rats fed a high-fat diet. (a-b) mRNA expression of Egr1 and Ptp1b. (c-d) Protein levels of EGR-1 and PTP1B. (e) Representative western blot images of EGR-1 and PTP1B. (f, g) Fluorescence intensities of EGR-1 and PTP1B. (h) Colocalization of EGR-1-PTP1B. (i) Representative fluorescence images of EGR-1 and PTP1B. Scale bars, 100 μm and 50 μm. All data are presented as mean ± SEM. For western blot, we selected 3 animals from each group, and assessments were repeated 3 times, which gives 9 protein bands per group (n = 3 per group). Five regions were randomly selected from each sample, and quantified (n = 8 per group); * P < 0.05, ** P < 0.01, *** P < 0.001

